K UK energy history
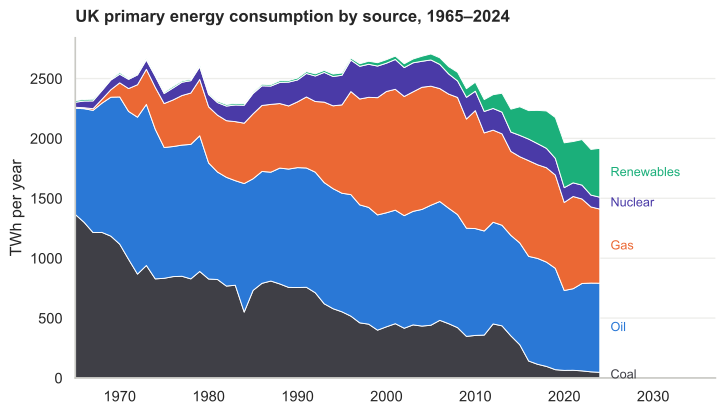
Editor’s note (2026 revision): MacKay’s original figures in this chapter run to about 2008. The chart below extends the picture to 2024, regenerated by this edition’s data-refresh script from Our World in Data (Energy Institute). It is not in MacKay’s original.
| Primary fuel | kWh/d/p | kWh(e)/d/p |
|---|---|---|
| Oil | 43 | |
| Natural gas | 47 | |
| Coal | 20 | |
| Nuclear | 9 | 3.4 |
| Hydro | 0.2 | |
| Other renewables | 0.8 |
Table K.1. Breakdown of primary energy sources in the UK (2004–2006). The nuclear row shows both primary heat (9) and the electricity it produces (3.4).
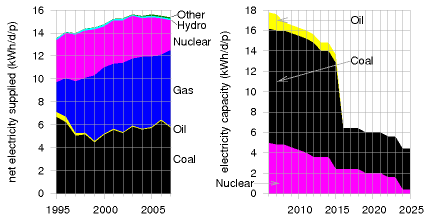
Figure K.2. Left: UK net electricity supplied, by source, in kWh per day per person. (Another 0.9 kWh/d/p is generated and used by the generators themselves.) Right: the energy gap created by UK power station closures, as projected by energy company EdF. This graph shows the predicted capacity of nuclear, coal, and oil power stations, in kilowatt-hours per day per person. The capacity is the maximum deliverable power of a source.
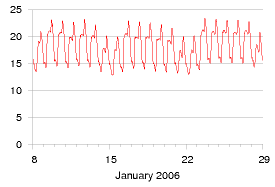
Figure K.3. Electricity demand in Great Britain (in kWh/d per person) during two winter weeks of 2006. The peaks in January are at 6pm each day. (If you’d like to obtain the national demand in GW, the top of the scale, 24 kWh/d per person, is the same as 60 GW per UK.)
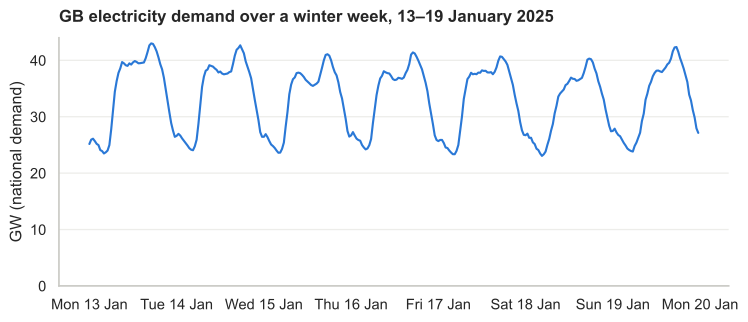
A recent equivalent (this edition): the same daily rhythm, overnight lows near 24 GW and evening peaks around 42 GW, weekdays higher than the weekend. Peak demand now runs well below MacKay’s era, whose scale topped out at 60 GW, because efficiency has cut it even as population and the economy grew.
| 2006 | 2007 | |
|---|---|---|
| “Primary units” (the first 2 kWh/d) | 10.73 p/kWh | 17.43 p/kWh |
| “Secondary units” (the rest) | 8.13 p/kWh | 9.70 p/kWh |
Table K.4. Domestic electricity charges (2006, 2007) for Powergen customers in Cambridge, including tax.
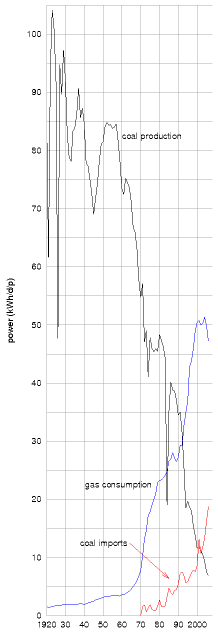
Figure K.7. UK production and imports of coal, and UK consumption of gas. Powers are expressed “per person” by dividing each power by 60 million.
Updated to 2024 (this edition): coal consumption has fallen from about 1,365 TWh in 1965 to near zero, while gas rose through the 1990s “dash for gas” and has declined since its mid-2000s peak. The two crossed over in the mid-1990s.
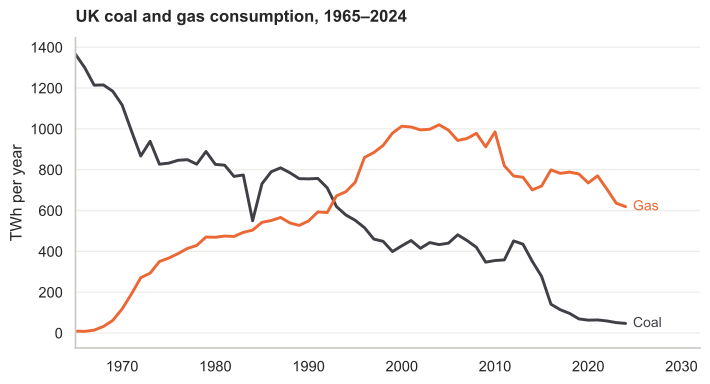
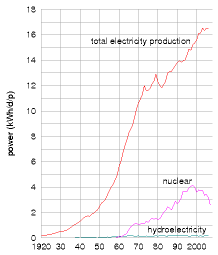
Figure K.5. History of UK production of electricity, hydroelectricity, and nuclear electricity. Powers are expressed “per person” by dividing each power by 60 million.
Updated to 2025 (this edition), by source and in MacKay’s kWh/d/p units, but dividing by the actual UK population each year rather than a fixed 60 million. Coal, which supplied about 10 kWh/d/p in the 1980s, is now near zero; wind has risen to about 3.4, close to gas.
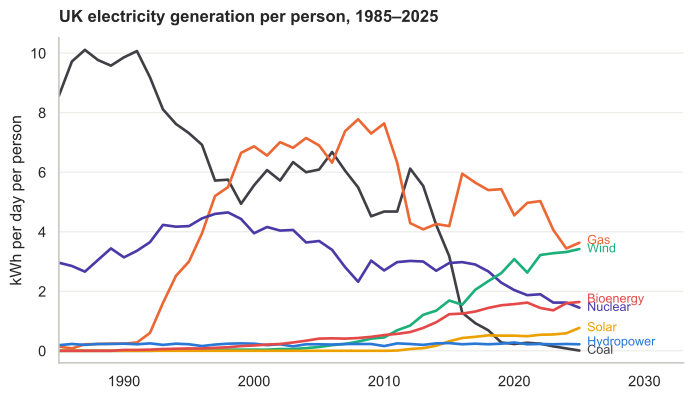
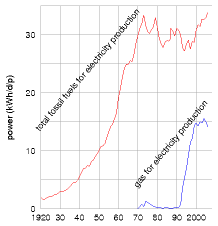
Figure K.6. History of UK use of fossil fuels for electricity production. Powers are expressed “per person” by dividing each power by 60 million.