23 Sustainable fossil fuels?
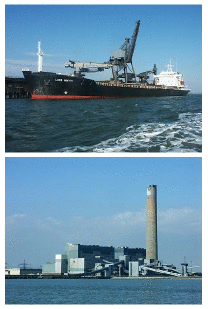
Figure 23.1. Coal being delivered to Kingsnorth power station (capacity 1940 MW) in 2005. Photos by Ian Boyle www.simplonpc.co.uk.

Figure 23.2. “Sustainable fossil fuels.”
It is an inescapable reality that fossil fuels will continue to be an important part of the energy mix for decades to come.
UK government spokesperson, April 2008
Our present happy progressive condition is a thing of limited duration.
William Stanley Jevons, 1865
We explored in the last three chapters the main technologies and lifestyle changes for reducing power consumption. We found that we could halve the power consumption of transport (and de-fossilize it) by switching to electric vehicles. We found that we could shrink the power consumption of heating even more (and de-fossilize it) by insulating all buildings better and using electric heat pumps instead of fossil fuels. So yes, we can reduce consumption. But still, matching even this reduced consumption with power from Britain’s own renewables looks very challenging (figure 18.7). It’s time to discuss non-renewable options for power production.
Take the known reserves of fossil fuels, which are overwhelmingly coal: 1600 Gt of coal. Share them equally between six billion people, and burn them “sustainably.” What do we mean if we talk about using up a finite resource “sustainably”? Here’s the arbitrary definition I’ll use: the burn-rate is “sustainable” if the resources would last 1000 years. 1 A ton of coal delivers 8000 kWh of chemical energy, 2 so 1600 Gt of coal shared between 6 billion people over 1000 years works out to a power of 6 kWh per day per person. A standard coal power station would turn this chemical power into electricity with an efficiency of about 37% – that means about 2.2 kWh(e) per day per person. If we care about the climate, however, then presumably we would not use a standard power station. Rather, we would go for “clean coal,” also known as “coal with carbon capture and storage” 3 – an as-yet scarcely-implemented technology that sucks most of the carbon dioxide out of the chimney-flue gases and then shoves it down a hole in the ground. Cleaning up power station emissions in this way has a significant energy cost – it would reduce the delivered electricity by about 25%. So a “sustainable” use of known coal reserves would deliver only about 1.6 kWh(e) per day per person.
We can compare this “sustainable” coal-burning rate – 1.6 Gt per year – with the current global rate of coal consumption: 6.3 Gt per year, and rising.
What about the UK alone? Britain is estimated to have 7 Gt of coal left. 4 OK, if we share 7 Gt between 60 million people, we get 100 tons per person. If we want a 1000-year solution, this corresponds to 2.5 kWh per day per person. In a power station performing carbon capture and storage, this sustainable approach to UK coal would yield 0.7 kWh(e) per day per person.
(Figure omitted from this edition: third-party rights.)
Figure 23.3. A caterpillar grazing on old leaves. Photo by Peter Gunn.
Our conclusion is clear:
Clean coal is only a stop-gap.
If we do develop “clean coal” technology in order to reduce greenhouse gas emissions, we must be careful, while patting ourselves on the back, to do the accounting honestly. The coal-burning process releases greenhouse gases not only at the power station but also at the coal mine. 5 Coal-mining tends to release methane, carbon monoxide, and carbon dioxide, both directly from the coal seams as they are exposed, and subsequently from discarded shales and mudstones; for an ordinary coal power station, these coal-mine emissions bump up the greenhouse gas footprint by about 2%, so for a “clean” coal power station, these emissions may have some impact on the accounts. There’s a similar accounting problem with natural gas: if, say, 5% of the natural gas leaks out along the journey from hole in the ground to power station, then this accidental methane pollution is equivalent (in greenhouse effect) to a 40% boost in the carbon dioxide released at the power station. 6
New coal technologies
Stanford-based company www.directcarbon.com are developing the Direct Carbon Fuel Cell, which converts fuel and air directly to electricity and CO2, without involving any water or steam turbines. They claim that this way of generating electricity from coal is twice as efficient as the standard power station.
When’s the end of business as usual?
The economist Jevons did a simple calculation in 1865. People were discussing how long British coal would last. They tended to answer this question by dividing the estimated coal remaining by the rate of coal consumption, getting answers like “1000 years.” But, Jevons said, consumption is not constant. It’s been doubling every 20 years, and “progress” would have it continue to do so. So “reserves divided by consumption-rate” gives the wrong answer.
Instead, Jevons extrapolated the exponentially-growing consumption, calculating the time by which the total amount consumed would exceed the estimated reserves. This was a much shorter time. Jevons was not assuming that consumption would actually continue to grow at the same rate; rather he was making the point that growth was not sustainable. His calculation estimated for his British readership the inevitable limits to their growth, and the short time remaining before those limits would become evident. Jevons made the bold prediction that the end of British “progress” would come within 100 years of 1865. Jevons was right. British coal production peaked in 1910, and by 1965 Britain was no longer a world superpower.
Let’s repeat his calculation for the world as a whole. In 2006, the coal consumption rate was 6.3 Gt per year. Comparing this with reserves of 1600 Gt of coal, people often say “there’s 250 years of coal left.” But if we assume “business as usual” implies a growing consumption, we get a different answer. If the growth rate of coal consumption were to continue at 2% per year (which gives a reasonable fit to the data from 1930 to 2000), then all the coal would be gone in 2096. If the growth rate is 3.4% per year (the growth rate over the last decade), the end of business-as-usual is coming before 2072. Not 250 years, but 60!
If Jevons were here today, I am sure he would firmly predict that unless we steer ourselves on a course different from business as usual, there will, by 2050 or 2060, be an end to our happy progressive condition.
Jevons, redone with 2025 numbers
A section added in the 2026 revision. Both halves of this chapter can now be checked against eighteen years of outcome, and both were wrong in instructive ways.
Take the arithmetic first. MacKay used a world coal consumption of 6.3 Gt a year in 2006 against reserves of 1600 Gt. The 2026 Statistical Review puts production at 8.06 Gt in 2025 and proved reserves at 1074 Gt, giving a reserves-to-production ratio of 139 years rather than the 250 that was quoted in his day.7 Note which number moved. Consumption rose by 28% over nineteen years, an average of 1.3% a year — considerably slower than the doubling-every-twenty-years that worried Jevons, and slower than MacKay’s own business-as-usual case. Reserves, meanwhile, were revised down by a third. The static ratio fell from 250 years to 139 mostly because the geologists changed their minds, not because we burned through it.
Repeating Jevons’ calculation properly, with consumption growing at the 1.3% a year actually observed, cumulative production passes 1074 Gt in about 78 years, which is the 2100s rather than MacKay’s 2050 or 2060. So the specific prediction in this chapter is too early by roughly half a century.
But the reason it is wrong is not that we found more coal. It is that exhaustion turned out not to be the binding constraint at all. Coal-fired electricity generation is now falling — down 0.3% worldwide in 2025, and down 3.4% in Europe — even as coal consumption set a record, because industry still wants it for steel and cement. What limits coal now is the price of the alternatives and the policy attached to the carbon, not the depth of the seam. Jevons framed the question as “how long until we run out?” and MacKay followed him. On present evidence the answer is that we will stop long before we run out, and the interesting question is what stops us.
What happened to clean coal
The other half of the chapter has aged less kindly. This chapter surveys the technologies that were expected to let fossil fuels continue with their carbon captured and stored, and the tone of the survey is reasonably hopeful.
Here is where that has got to. Total carbon capture capacity worldwide reached 206 million tonnes a year in 2024, up from 180 million in 2020 — growth of about 15% in four years. Set that against energy-related carbon dioxide emissions of 35 806 million tonnes in 2025 and it is 0.6% of the problem, and that is installed capacity, which flatters the position, since capture facilities routinely run below nameplate.8 After three decades of expectation, carbon capture removes about one part in 170 of the carbon dioxide the energy system emits.
That does not make it useless. It makes it a specialised tool rather than a general licence, and it changes what the chapter’s question means. “Can we have sustainable fossil fuels?” was posed as a technical question about whether the carbon could be caught. It can be, and at Sleipner in Norway it has been since 1996. The eighteen years since this book was written have established something narrower and more useful: capture works, and it has not been built, and it has not been built for reasons of cost and incentive rather than physics. That is exactly the shape of the argument in chapter 28a — a technology whose returns depend on a price that policy has not set will not be financed, however well it works.
What “cost and incentive” means, in numbers
Added in the 2026 revision. The paragraph above asserts that capture works and has not been built, and that the reason is money. That deserves the numbers, because the project record is where the argument actually lives.
Gorgon, on Barrow Island off Western Australia, is the largest carbon capture project in the world. Chevron committed to capturing 80% of the reservoir carbon dioxide from its liquefied-gas plant as a condition of approval. In 2023–24 it managed 30%, its worst year on record, and the cost has risen to about $222 (£175) per tonne captured. Petra Nova, in Texas, was the flagship retrofit of a coal plant: about $1 billion to build, roughly 70% capture when running well, shut down in 2020 when the oil price collapsed — because the carbon it captured was being sold for enhanced oil recovery, so its revenue depended on the price of the product it was meant to displace. NRG later sold its 50% interest for $3.6 million — against a half share of a roughly $1 billion build, so under a hundredth of what that stake originally represented. Kemper County, in Mississippi, was to gasify lignite and capture the carbon before combustion; it was estimated at $3 billion, reached $7.5 billion, and was abandoned as a coal project in 2017.9
Two numbers frame that record. The United States Department of Energy’s own assessment was that capture cost would have to halve, to about $30 (£24) a tonne, to be commercially viable without support. And there is now support: the American 45Q credit pays $85 (£67) per tonne for point-source capture with geological storage and $180 (£142) for direct air capture, indexed from 2027. For the first time the subsidy exceeds the cost of capture at some well-suited sources — concentrated streams from ethanol, ammonia and gas processing, where the carbon dioxide is nearly pure and separation is cheap. It does not exceed the cost at a coal or gas power station, where the flue gas is dilute and the parasitic load is large.
That is the real shape of the thing, and it is not the shape either the enthusiasts or the opponents describe. Capture is already economic where the carbon dioxide arrives pure and uneconomic where it arrives dilute — which is to say, economic almost everywhere except the application this chapter was written about. Sleipner has worked since 1996 because stripping carbon dioxide out of natural gas is something the gas industry has to do anyway.
One more caution on the capacity figure above. The 206 million tonnes a year is capacity, and the industry’s own trackers put operating capacity in early 2025 nearer 50 million tonnes. Against 35 800 million tonnes of energy-related emissions, that is 0.14%, or one part in seven hundred. Net-zero pathways of the kind the IEA publishes assume something like 1300 million tonnes a year. The gap is not a factor of two.
Methane: MacKay’s calculation, now measurable
A section added in the 2026 revision. This chapter’s notes contain a piece of arithmetic that has become far more important than it looked in 2008. MacKay observes that leaked methane is worth about 8.4 times the warming of the carbon dioxide you would get by burning it — twenty-three times as potent per tonne, divided by the 2.75 tonnes of carbon dioxide each tonne of methane would have become — and concludes that a 5% leak is equivalent to a 40% boost in carbon dioxide.
The arithmetic is right. What he could not do was measure the leak. In 2008 leakage rates were inventory estimates: production multiplied by an assumed emission factor. Since 2024 they have been observed from orbit. MethaneSAT, launched in March 2024, measures basin-scale methane intensity directly — emissions as a percentage of the gas produced — and the results have not flattered the inventories. American oil and gas methane emissions came out over four times higher than the Environmental Protection Agency’s estimates. The Permian Basin alone was releasing on the order of 440 tonnes of methane an hour, more than half a billion dollars a year of wasted gas.10
Now apply MacKay’s own factor to the measured rates:
| Measured leakage | Extra warming on MacKay’s 8.4× | |
|---|---|---|
| Permian, New Mexico side | 1.2% | +10% on the combustion CO2 |
| Permian, Texas side | 3.1% | +26% |
| MacKay’s illustrative case | 5% | +42% |
The two rows that matter are the first two, and they are the same basin. The Delaware Basin straddles a state line; the rock is the same, the companies are largely the same, and the leakage rate on one side is two and a half times the other. New Mexico has rules requiring 98% gas capture and the venting and flaring restrictions that go with them; Texas does not.
That is as clean a natural experiment as this subject offers, and it settles a question this chapter could only pose. Whether gas is better than coal is not a property of gas. At 1.2% leakage the case for gas over coal in power generation is comfortable. At 3.1% it is narrower than usually claimed, and for the short-lived warming that matters most on a twenty-year view it is narrower still. The difference between those two worlds is not geology, technology, or price. It is regulation, and it is now visible from space, which is why it has started to change.11

Notes and further reading
The average methane content in British coal seams is 4.7 m3 per ton of coal (Jackson and Kershaw, 1996); this methane, if released to the atmosphere, has a global warming potential about 5% of that of the CO2 from burning the coal.
Further reading: World Energy Council [yhxf8b]
Further reading about underground coal gasification: [e2m9n]
1000 years – my arbitrary definition of “sustainable.” As precedent for this sort of choice, Hansen et al. (2007) equate “more than 500 years” with “forever.”↩︎
1 ton of coal equivalent = 29.3 GJ = 8000 kWh of chemical energy. This figure does not include the energy costs of mining, transport, and carbon sequestration.↩︎
Carbon capture and storage (CCS). There are several CCS technologies. Sucking the CO2 from the flue gases is one; others gasify the coal and separate the CO2 before combustion. See Metz et al. (2005). The first prototype coal plant with CCS was opened on 9th September 2008 by the Swedish company Vattenfall [5kpjk8].↩︎
UK coal. In December 2005, the reserves and resources at existing mines were estimated to be 350 million tons. In November 2005, potential opencast reserves were estimated to be 620 million tons; and the underground coal gasification potential was estimated to be at least 7 billion tons. [yebuk8]↩︎
Coal-mining tends to release greenhouse gases. For information about methane release from coal-mining see www.epa.gov/cmop/, Jackson and Kershaw (1996), Thakur et al. (1996). Global emissions of methane from coal mining are about 400 Mt CO2e per year. This corresponds to roughly 2% of the greenhouse gas emissions from burning the coal.↩︎
If 5% of the natural gas leaks, it’s equivalent to a 40% boost in carbon dioxide. Accidental methane pollution has nearly eight times as big a global-warming effect as the CO2 pollution that would arise from burning the methane; eight times, not the standard “23 times,” because “23 times” is the warming ratio between equal masses of methane and CO2. Each ton of CH4 turns into 2.75 tons of CO2 if burned; if it leaks, it’s equivalent to 23 tons of CO2. And 23/2.75 is 8.4.↩︎
Coal production, reserves and generation from the Energy Institute’s Statistical Review of World Energy 2026 edition. Reserves are as at end-2020, the most recent assessment, and the Review notes that its methodology for updating reserves is under review. The 78-year figure is a Jevons-style calculation: cumulative production at 1.3% annual growth from a 2025 base of 8.06 Gt, reaching 1074 Gt.↩︎
Capture capacity from the Statistical Review’s “CCUS Capture Capacity” sheet: 180.1 Mt/year in 2020 and 206.5 Mt/year in 2024. Compared with 35 806 Mt of energy-related CO2 in 2025 from the same source, that is 0.58%.↩︎
Gorgon’s 2023–24 capture performance and its cost per tonne are from the Institute for Energy Economics and Financial Analysis’s annual assessments of the project; the 80% target is the condition of the Western Australian environmental approval, and Chevron has acknowledged missing it since start-up in 2019. Petra Nova’s approximately $1 billion construction cost, its suspension in 2020 and NRG Energy’s later sale of its 50% interest for about $3.6 million are widely reported; the plant restarted under new ownership in 2023. Kemper County’s escalation from about $3 billion to $7.5 billion and Southern Company’s 2017 decision to abandon the gasification and capture portion are from the company’s own filings. The $30 per tonne commercial-viability figure was given by an assistant secretary for fossil energy at the Department of Energy in 2020. IEEFA is a research organisation with a critical stance on fossil-fuel investment and its framing should be read with that in mind; the underlying performance figures come from Chevron’s own reporting to the Western Australian regulator. The operating-versus-capacity distinction is the reason the 50 Mt and 206 Mt figures differ: the larger number counts announced and installed nameplate capacity, the smaller counts what was actually operating.↩︎
MethaneSAT, an Environmental Defense Fund mission launched in March 2024, measures methane column concentrations at basin scale and derives a methane intensity — emissions as a fraction of gas produced. The Permian figures of about 1.2% intensity on the New Mexico side of the Delaware Basin and about 3.1% on the Texas side, and the finding that United States oil and gas methane emissions are more than four times the EPA inventory, are from its 2025–26 releases and the associated peer-reviewed work. Two cautions. EDF is an advocacy organisation as well as a science funder, though the retrievals are published in the open literature and are broadly consistent with earlier aircraft campaigns, which put Permian leakage near 3.7% and the national figure near 2.3%. And satellite retrievals have their own limitations — they see a column at a moment, are poor over water and at high latitudes, and require assumptions about wind fields to convert concentration into flux. The mission itself ceased operating in mid-2025 after losing contact; its published data remain.↩︎
New Mexico’s 2021 natural gas waste rules require operators to capture 98% of produced natural gas by the end of 2026 and restrict routine venting and flaring; Texas has no equivalent statewide capture requirement. Attributing the whole intensity difference to regulation is more than the data strictly support — the two sides of the basin also differ in well age, operator mix and gathering infrastructure — but the regulatory difference is the largest identified factor and is the one the observing teams themselves emphasise. The 8.4× ratio and the 5%-equals-40% calculation are MacKay’s own, in this chapter’s note 6, and use a 100-year global warming potential of 23 for methane; more recent assessments put the 100-year figure nearer 28–30 and the 20-year figure near 80, which makes the comparison worse for gas rather than better.↩︎