11a The machines behind the screen
Editor’s note: this chapter is new in the 2026 revision. It is not David MacKay’s writing. Added by Örjan Lundberg.
Chapter 11 has a short section called “Powering the hidden tendrils of the information age”. It reports Jonathan Koomey’s finding that in 2005 the servers in American data centres, with their cooling and backup power, used 0.4 kWh per day per person — “just over 1% of US electricity consumption” — and notes that this had doubled since 2000 as the server count went from 5.6 to 10 million.
MacKay put that in a chapter about gadgets, and in 2005 he was right to. A percent of national electricity is a rounding error next to heating and driving. This chapter exists because the tendrils stopped being hidden.
What the number is now
| Data centre electricity | Share of that grid | |
|---|---|---|
| World, 2024 | 415 TWh | 1.5% |
| United States, 2023 | 176 TWh | 4.4% |
| European Union, 2024 | 68 TWh | 2.5% |
| United Kingdom, 2025 | 7 to 17 TWh | 2.5 to 6% |
| Sweden, 2025 | 4.0 to 4.4 TWh | 3% |
| Ireland, 2024 | about 7 TWh | 22% |
In this book’s units, an American’s share of data-centre electricity is about 1.4 kWh/d, against MacKay’s 0.4 twenty years ago. A citizen of the world averages 0.14. A citizen of the European Union averages 0.41 — MacKay’s own figure, as though nothing had happened — and the Commission, quoting the IEA, expects that to reach 0.7 by 2030, when data centres would take 3.2% of the Union’s electricity.1 A British person’s share is between 0.3 and 0.7 kWh/d, the range reflecting a genuine disagreement about what counts. An Irish person’s share is about 3.6 kWh/d — which is close to the 5 kWh/d that chapter 11 offers as the figure for a whole houseful of gadgets left on all the time. A Swede’s is about 1.1 kWh/d, above the British figure and not far below the American, because Sweden has a great many data centres and not many people to divide them among.2,3
The British range needs explaining, because it is wide. The lower figure, about 2.5% of national electricity, is the one usually quoted for data centres proper. A 2026 assessment put the United Kingdom and the United States both near 6%, which is roughly double. The gap is boundary: whether telecoms and networking equipment count, whether enterprise server rooms inside ordinary offices count, and whether cryptocurrency mining counts. National Grid’s Future Energy Scenarios projects 5.2 GW and just over 20 TWh a year by 2030, which would be about 7% of British electricity and roughly a fourfold rise.4
Ireland is the case worth staring at, because it is the future arriving early in a small country. Data centres took 5% of Irish electricity in 2015 and 22% in 2024, more than quadrupling in nine years. No other consumer of electricity has ever grown like that inside a developed grid, and Ireland now has more of its power going into computation than into all its homes’ lighting, cooking and appliances combined.
Sweden is worth a paragraph of its own, because it is the case this chapter’s later sections keep returning to, and because its projected trajectory is among the steepest in Europe. The Swedish Energy Agency puts Swedish data centres at 4.0 to 4.4 TWh in 2025, about 3% of national electricity — and notes that its own estimate predates the AI build-out, so it is likely to be low. Svenskt Näringsliv, the employers’ confederation, projects 14 to 15 TWh by 2030, which would be 10% of Swedish electricity and about 3.6 to 3.9 kWh/d per person.
That projection is not a forecast of something new. It is the same order as Ireland’s present, which this chapter gives as about 3.6 kWh/d — so the question is not whether such a share is possible but what happens to a grid when it arrives in five years rather than fifteen.
The connection queue says it is arriving fast, and the section on grid position below gives the national figure: about 9000 MW applied for in 2025, roughly half of it data centres.5
There is a second way to size the fleet, and it puts the countries in a different order. Instead of asking what share of a country’s electricity goes into computation, ask how large the machines are next to the grid they plug into: total data-centre IT capacity, in megawatts, against the highest load that grid has to meet. That is the question a system operator asks, because a peak is what the network is built for.
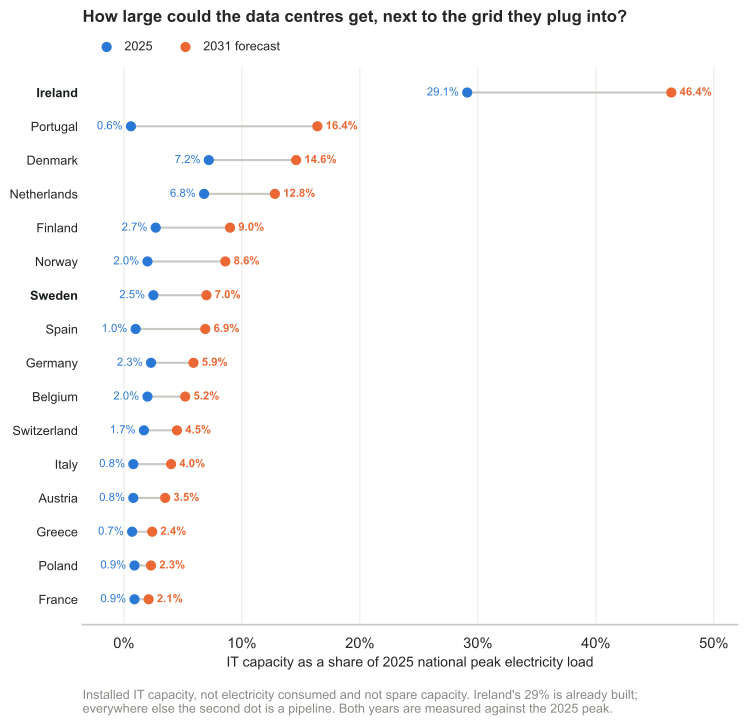
Figure 11a.1. Total data-centre IT capacity, colocation and hyperscale-owned together, as a percentage of 2025 national peak electricity load. Both dots are measured against the same 2025 peak, so the 2031 dot is capacity over today’s peak rather than a forecast of the 2031 ratio. Installed capacity is not consumption: no facility draws its nameplate. The United Kingdom is not in the source.6
The chart and the table at the head of this chapter are measuring different things, and the gap between them is instructive. Ireland’s data centres are 29.1% of peak load as capacity, and 22% of metered electricity in 2024 as energy; Sweden’s are 2.5% and about 3%. A fleet running flat out would show an energy share well above its capacity share, because a national grid spends most of the year below its peak — at a load factor near 0.6, which is typical for Europe, Ireland’s 29.1% would meter as something near 48% and Sweden’s 2.5% as 4%. Both countries meter less than that. The chart shows what has been built and the table shows what it drew, and the distance between them is however much of the installed capacity is idle at any moment.
Which is why the multiples are the part to read, and Sweden’s is the check this chapter needs. Swedish capacity goes from 2.5% of peak to 7.0%, a 2.8-fold rise over the six years to 2031, or about 19% a year. Svenskt Näringsliv’s projection, arrived at from market forecasts rather than from installed hardware, takes Swedish data centres from 3% of electricity to 10% by 2030 — 3.3-fold over five years, or about 27% a year. Those are not the same number, and the horizons differ; what they share is the order, and two methods with no inputs in common agreeing to within a third is about as much agreement as this subject offers. Ireland’s multiple is 1.6, the smallest of the sixteen: its growth is behind it, and the countries with the steep arms are the ones that have not yet had the argument. Portugal, which has almost no data centres today at 0.6% of peak, is forecast at 16.4% — a 27-fold rise, and second only to Ireland by 2031.
The growth rate is the whole story
Absolute numbers understate this, because the interesting quantity is the exponent.
American data-centre demand grew at about 7% a year from 2014 to 2018, then 18% a year from 2018 to 2023, and is projected at 13 to 27% a year to 2028, reaching 325 to 580 TWh, or 6.7 to 12% of American electricity. Globally the IEA expects 485 TWh in 2025 to become about 950 TWh in 2030, roughly 3% of world electricity.7
Notice what the 2018 inflection is. Between 2010 and 2018 data-centre computing rose enormously while electricity barely moved, because efficiency — better chips, virtualisation, hyperscale facilities replacing cupboards full of servers — absorbed the growth. That is the same story as chapter 9’s light bulb: the service expanded and the energy did not.
Then it stopped working. The efficiency gains ran out at roughly the moment demand for AI training and inference began, and since 2018 the curve has followed demand rather than efficiency. Servers for artificial intelligence were 24% of server electricity and 15% of total data-centre energy in 2024, and are projected at 35 to 50% of data-centre power by 2030.
This is the shape MacKay’s method is built to expose. A quantity growing at 18% a year doubles in four years. Applied to something that is already 4% of a national grid, four more doublings reaches the whole grid. The exponent cannot continue, and the interesting question is what stops it.
How much for one answer?
Chapter 11 is built out of small measurements: a phone charger at less than a watt, a laptop at 20, a stereo left on all night. The same question can be put to the machines this chapter is about. What does one answer cost?
Google published a figure in August 2025, and it is the only one from an operator that states its method. The median Gemini Apps text prompt uses 0.24 Wh of electricity, emits 0.03 g of CO2e and consumes 0.26 ml of water — five drops. The boundary covers the accelerator chips, the host machine around them, idle capacity held ready, and the data centre’s own overhead. Google also reports that the same median prompt fell 33-fold in energy and 44-fold in carbon over the preceding twelve months, which is the efficiency curve of the section above arriving at the scale of a single query.
Set beside it, Stephen Witt’s estimate in the New Yorker for a longer piece of work: an AI writing a college term paper produces about 5000 tokens and uses roughly what a microwave oven at full power uses in three minutes. Call that 40 to 60 Wh, depending on whether you take the oven’s rated output or its draw at the wall, and it is around 200 median Gemini prompts.8
The gap between the two is mostly a difference of question. A median prompt is short, and half of all prompts are shorter still. Five thousand tokens is a long answer, and a reasoning model that thinks before it writes can spend several times its visible output. Google’s boundary also leaves out training, a fixed cost spread over every query the model ever answers, which nobody outside the labs can apportion.
Now do MacKay’s check, which is to see whether the small number and the big number meet. An American’s share of data-centre electricity is 1.4 kWh/d. Servers for artificial intelligence were 15% of data-centre energy in 2024, so the AI part is roughly 0.21 kWh/d, or 210 Wh a day for every American. At Google’s 0.24 Wh that is about 900 median prompts a day each. At Witt’s rate for a long answer it is four.
Nobody sends 900 prompts a day. Plenty of people get through four long answers. Two things account for the distance, and both are worth having. American data centres serve users everywhere, so dividing their electricity by the American population overstates what an American uses. And most of the electricity is not median text prompts at all: it is training runs, image and video generation, and the tail of heavy inference that a median hides by construction.
The lesson is the one MacKay draws whenever a bottom-up estimate and a top-down measurement fail to meet. Trust the meter. A per-prompt figure answers “what did this cost?” honestly and makes a poor basis for a national total, because the median user is not where the electricity goes.
Why the data centre wins the electron
The section above says a data centre “can pay more per kilowatt-hour than a smelter”. The elmix model puts a number on that, and the number is the whole explanation.
An electron does not know what it is for, but the buyers do. A power-intensive industry — an aluminium smelter, an ammonia plant, a silicon works — turns a kilowatt-hour into a few kronor of product. Electricity is a large share of its cost, which is why chapter 28a’s industrial price is existential for it. A hyperscale data centre running AI workloads turns the same kilowatt-hour into something on the order of 80 to 100 kronor — roughly £6.50 to £8, or €7.50 to €9.50 — of revenue. One reported arrangement, Anthropic renting about 300 MW of xAI compute for roughly $1.25 billion a month, works out near $5.70 per kWh: about £4.50, €5.30, or 53 kronor.12
That is roughly an order of magnitude above what heavy industry earns from the same electricity. In any auction for the same connection, at any plausible price, the data centre wins — not because it is favoured but because electricity is a rounding error in its cost structure and the dominant term in the smelter’s.
The consequence is visible where the market prices capacity explicitly rather than only energy. In the American PJM market, data-centre demand drove capacity auction prices up roughly tenfold, and accounted for 63% of the 2025/26 increase.
The fork
The elmix model calls the result a demand fork, and the two arms are very different lengths.
- Data centres in the EU: about 70 TWh in 2024 rising to 115 TWh by 2030, growing near 15% a year — more than four times faster than all other sectors combined, though still under a tenth of global demand growth.
- Electrified industrial heat: a technical potential of about 600 TWh in the EU — nearly nine times larger, and the thing this book has been arguing for since chapter 7.
Both arms want the same scarce grid capacity and the same clean generation. One of them can pay eighty kronor — about £6.50 — a kilowatt-hour and be built in eighteen months. The other cannot and takes a decade.
That is the awkward finding, and it is not a technical one. Every chapter of this book that argues for electrification — heat pumps in chapter 7, industrial heat in chapter 28a, transport in chapter 3 — is arguing for loads that lose a bidding war against computation. Nothing in the physics decides this. The connection queue does.
West London, where the losing arm was housing
Britain has already run this experiment, and the arm that lost was not industry but housing.
In summer 2022 the Greater London Authority found that three west London boroughs — Ealing, Hillingdon and Hounslow — had effectively run out of electrical connection capacity, with the constraint reaching outward to Slough and Egham. Developers were told that new housing in the area might not be connectable until 2035. The proximate cause was that data centres along the M4 corridor had taken the available headroom.13
Two things should be said fairly. The data-centre sector disputes the blame, pointing out that the distribution network was under-invested for decades and that any large load arriving at once would have exposed it. And the position has improved: from March 2024 a capacity-allocation study by the network operator unlocked 3315 permitted homes, and City Hall reports at least 11 690 permitted homes since released.
But the shape of the episode is the point, and it is the demand fork with a British postcode. A load that earns tens of pounds per kilowatt-hour arrived quickly and was connected. Loads that earn nothing per kilowatt-hour — houses — waited, and needed a public body to intervene on their behalf. No price signal produced that outcome. A queue did.
Sweden shows the same thing at national scale: connection applications in 2025 totalled about 9000 MW, roughly half of it data centres, concentrated in Mälardalen, Stockholm, Uppsala and Gävleborg — and Microsoft’s Sandviken project was paused in the resulting crunch. A country that spent a decade arguing about whether it had enough electricity for its industry now finds the question settled by a different bidder.14
And the queue rule is being rewritten
The section above says a queue decided the outcome and no price signal did. That is a statement about a rule, and rules get changed. In April 2026 Svenska kraftnät reported to the Swedish government on the connection process, and the finding at the centre of it is the one this chapter has been circling — translated here from the report’s Swedish, with the emphasis added:
The connection process for the transmission network today contains no explicit valuation of how a connection affects different forms of system benefit, despite such effects having direct significance for both the electricity system’s total costs and its security of supply.
The operator’s own conclusion is that system benefit — systemnytta — needs integrating into the connection decision, through capacity zones that would admit connections on what they contribute rather than on when they applied. It is careful to say the design is unfinished: introducing such a zone “requires further work before a finished proposal can be presented and a first zone established”, covering both continued internal development of the process and deeper dialogue with the regional network companies and the industry.
Two things in that report bear directly on this chapter, and they pull in different directions.
The first confirms the demand fork from an unexpected quarter. Svenska kraftnät observes that some of the new electricity-intensive demand — naming certain categories of data centre — appears “considerably less dependent on the electricity price to generate a good economic return, and can therefore be assumed less inclined to adapt its electricity use”. That is this chapter’s argument, made by the system operator: a load for which electricity is a rounding error will neither be priced away nor asked to move. It is the flexibility problem stated as a procurement problem.
The second is a caution against reading the European position too neatly. In December 2025 the Commission issued guidance on faster grid connections, and Svenska kraftnät reads it as broadly supportive of prioritisation frameworks. But among the legitimate bases for prioritising that the report has the Commission naming are “electrification of transport, industry or the establishment of data centres” — provided the framework is well motivated, transparent and consistent with European network-access principles. That phrase is Svenska kraftnät’s summary of the guidance rather than the Commission’s own words, and this edition has not obtained the notice’s English text to set beside it; but the summary is the thing Swedish policy will be built on. Brussels is not ranking industry above computation. It is saying a member state may rank, and leaving the ranking to the member state.15
Which is the honest shape of the thing. The constraint was never physical, and it is now explicitly a policy variable: somebody will decide what a connection queue is for. This chapter’s contribution is only to insist that whoever decides should be able to say what each applicant returns per megawatt-hour — of jobs, of tax, of system benefit — because the queue will hand out the electricity whether or not anyone has done that arithmetic.
And in America they stopped the queue instead
Svenska kraftnät’s answer to a queue that cannot choose is to teach it to choose. Three American states, in five weeks of the summer of 2026, tried the blunter thing.
On 14 July the Governor of New York signed Executive Order 62, pausing state environmental permits for new hyperscale data centres — those drawing 50 MW or more — for up to a year, while the state prepares a generic environmental impact statement covering energy demand, water use and air quality. On 3 August the Governor of Texas directed the Public Utility Commission and ERCOT to audit every data-centre project in the interconnection queue before any more advance, and ERCOT paused interconnections in response. There were about 1800 projects in that queue, and BloombergNEF put the load at risk of delay at 49.8 GW, near a fifth of the American development pipeline. On 18 August the Governor of Pennsylvania signed Executive Order 2026-05, which takes data centres out of the state’s fast-track permitting route, sets requirements on electricity and water use, requires local approval, and forbids the non-disclosure agreements that had kept the terms of these projects out of public view.16
Behind all three is a poll. Gallup asked 1000 Americans in March 2026 whether they would favour an AI data centre being built in their local area. 71% were opposed and 48% strongly opposed, against 25% in favour. Majorities of every party group opposed it. In the same survey, 53% opposed a local nuclear power plant — a technology that has spent fifty years as the standard example of the thing nobody wants nearby. Water and energy use was the reason given by half of those opposed.17
At federal level, Senator Sanders introduced S.4214 on 25 March 2026 and Representative Ocasio-Cortez the companion H.R.9442 on 24 June, which would halt construction of covered AI data centres until Congress had legislated on their effect on bills, emissions and employment. Neither is likely to pass.18
The Swedish and the American response look like opposites and carry the same admission. One would rank the queue by what each applicant returns; the other stops the queue until somebody has worked out what to ask. Both concede that a rule which hands out the largest new load on the grid in order of arrival was never built to make that choice, and is now being asked to.
And Britain asked what the rules were insuring against
Sweden would teach the queue to choose and America stopped the queue. In September 2026 a British review asked a third question, which is not about the queue at all: not who should get the connection, but whether the grid needs as much headroom as its own rules insist on.
The Grid We Need Now, Lucy Yu’s independent review of AI deployment in the electricity networks, was commissioned by the Department for Energy Security and Net Zero and reports that Great Britain runs its grid on deterministic standards — rules that insure against pre-specified worst cases whatever the conditions actually are, rather than measuring risk continuously. The review’s verdict on that is the sentence worth keeping: the approach “hardcodes higher than necessary costs into how the grid is run.” Its first recommendation is that government commit to full probabilistic, risk-based operation by 2035 and planning by 2036.
The reason the rules have started to hurt is chapter 26’s subject arriving in the statistics. The proportion of British half-hours in which weather-dependent renewables supplied more than 30% of generation went from about 2% in 2015 to 64% in 2025; the share above 50% was negligible until 2019 and reached 24%. A rule that insures against the worst case grows more expensive as the worst case grows more severe, and it has: balancing costs rose from £1.2 billion in 2018/19 to £2.7 billion in 2024/25, with constraint costs alone going from £0.4 billion to £1.7 billion, and the review’s forecast is £3.4 to £4.9 billion a year in 2031–35 even after the network build planned for 2030. Per person that is £39 a year now and £50 to £72 then — small beside a household bill, and it is the price of running the system rather than of the electricity in it.
Two things in the review bear on this chapter directly.
The first is a cross-check. The review has British data-centre electricity demand rising four-fold by 2030, on a House of Commons Library source, alongside compute demand more than doubling. That is a second route to the multiple this chapter already quotes from National Grid’s Future Energy Scenarios — 5.2 GW and just over 20 TWh by 2030, “roughly a fourfold rise” — and the two do not share a method. It also sets the load in company: British electricity demand is forecast to grow more than 30% by 2035, with “housing, transport, industry and data centres all being dependent on increased availability of power”. Four claimants, one queue.
The second is the arithmetic, and it is the reason this section is here. AI appears on both sides of the grid’s ledger, and the two sides are nowhere near the same size. Set out the savings the review can actually quantify: Dynamic Line Ratings across 275 km of transmission line, about £20 million a year, with a further £50 million over five years as the rollout reaches 900 km; Dynamic Reserve Setting, which in trial held 380 MW less reserve, about £30 million a year; better solar forecasting, about £30 million a year. Call it £90 million a year of demonstrated saving, against a balancing bill of £2700 million — about 3%, and between a twentieth and an eighth of the increase the review forecasts for the 2030s.
That is not an argument that the tools are worthless. The review is careful to say the full value of probabilistic operation is “extremely difficult to quantify” for a real grid, and cites an academic study finding operating costs 11% lower on a 24-bus theoretical system — which would be some £300 million a year here, if it generalised, and the review says it cannot be relied on to. The point is narrower and harder to argue with: the demonstrated savings from putting AI into the grid are some thirty times smaller than the balancing bill it is meant to reduce, while the demand from putting AI into data centres is set to quadruple in the same five years. Both numbers are British, both are from the same government-commissioned document, and only one of them is growing at the rate this chapter’s second section describes.
The review is honest about the boundary that produces that asymmetry. Its foreword says the siting and energy use of data centres was out of scope — while adding that the sustainability of the infrastructure needed to build and run AI should not be dismissed, and cannot be left entirely to industry. A review of what artificial intelligence can do for the electricity network was not asked what artificial intelligence will do to it. This chapter is the other half.19
Who pays for the winning bid
The sections above establish that a data centre outbids everything else for a connection. They do not say who pays for that, and the answer is not the data centre.
A wholesale electricity market sets one price for everyone at the same place and time, and it sets it at the cost of the last generator needed. A buyer that can afford almost any price wins its own megawatt-hour and raises the price of everyone else’s at the same node. Bloomberg examined wholesale prices at tens of thousands of nodal pricing points across American grids and found increases of up to 267% between April 2020 and April 2025, with more than 70% of the nodes that rose lying within 50 miles of significant data-centre activity.
The retail side has moved with it. PowerLines, which tracks rate cases, counted about $31 billion of requested rate increases across American utilities in 2025, roughly double 2024; through the first three quarters, requests and approvals together came to over $34 billion, reaching 124 million billpayers.20
Read both numbers carefully, because they are routinely overstated. The 267% is the largest increase at any node, not an average and not a bill; retail rates rose by nothing like that, and fact-checkers have said so of politicians who implied otherwise. Rate cases have several causes running at once — replacing old wires, storm and wildfire costs, gas prices — and data centres are one term among them. In some places the new load has spread fixed network costs over more kilowatt-hours and pushed bills down.
What survives the caveats is structural, and it is the sequel to this chapter’s central claim. A buyer for whom electricity is a rounding error will pay whatever clears the market, and everyone standing at the same node pays it too. The data centre is bidding honestly in a market built for buyers who care about the price. It creates a cost it does not carry. West London’s queue made that transfer visible as houses that could not be connected; an American node makes it visible as a bill.
The jobs behind the machines
The section on why the data centre wins the electron explains that it turns a kilowatt-hour into more revenue than any competing buyer. The same property has a second consequence, and it points the other way. Of all the large loads on a grid, the data centre returns the least of that kilowatt-hour as local wages. Both facts have one cause, which is that the machine is enormously capital-intensive and barely staffed.
Put the staffing on a per-megawatt basis, since that is how the electricity arrives. Industry surveys give a small facility of 1 to 5 MW around 2 to 3 staff per MW, one of 5 to 20 MW around 1.75 to 2.5, a large one of 20 MW and up between 1 and 1.5, and an ultra-hyperscale campus above 100 MW between 0.2 and 0.3. Google’s Kansas City campus, at 500 MW, employs about 200 permanent staff: 0.4 jobs per MW.21
Now convert to energy, which is the unit this book uses. A megawatt running at 85% of the time delivers 7.45 GWh in a year. At 1.5 jobs per MW that is about 5000 MWh of electricity per job-year; at Kansas City’s 0.4 it is about 19 000; at 0.2 it is about 37 000. Take 5000 to 37 000 MWh per job-year as the range, and note two things about it. It applies to facilities of 20 MW and up, which is what this chapter means by a large load on a grid; the halls below 20 MW are about twice as well staffed and land at 2500 to 4300, which as the next paragraph shows is smelter territory. And within the range, the newest and largest sites sit at the wrong end.
Two comparisons give that number a scale. Kubikenborg Aluminium at Sundsvall, the most electricity-hungry single plant in Sweden, employs about 470 people and uses roughly 1.6 TWh a year — about 3400 MWh per job-year, and that is a smelter, the traditional emblem of a lot of power for few jobs. The Swedish and American economies as a whole each use about 25 MWh of electricity per job-year. So a hyperscale data centre consumes somewhere between 200 and 1500 times as much electricity per job as the economy it sits in, and between about one and a half and eleven times as much as an aluminium smelter. A small data hall, by the same arithmetic, is roughly the smelter’s equal. The finding is about scale, not about computation as such, which is worth holding onto, because it is the large sites that are being built.22
The aggregate check agrees with the arithmetic. Food & Water Watch, working from Bureau of Labor Statistics data and Virginia’s capacity, estimates that as few as 23 000 people held a permanent data-centre job in the United States in 2024 — 0.01% of American employment, against 4.4% of American electricity. The industry’s own figure, from a PricewaterhouseCoopers report for the Data Center Coalition, is 603 000. The gap is definitional rather than dishonest: PwC counts the whole of industry classification 518210, “data processing, hosting, and related services”, which also holds web hosting, cyber security and data-labelling firms; it counts posts rather than full-time equivalents; and it applies an indirect multiplier. The tell is geographic. Virginia has about a third of American data-centre capacity and 4% of the 518210 jobs.23
In Sweden the arithmetic reaches the public finances through a specific mechanism. Municipalities are funded by kommunalskatt, a tax on the wages of people who live there. Corporation tax and energy tax go to the state. A load can therefore produce a great deal of value added and very little municipal revenue, because the municipality is paid in jobs and this load does not have many. The energy-tax reduction that data centres had enjoyed since 2017 was abolished on 1 July 2023, so the state now collects full energy tax on them, though sites in the northern municipalities may still take the standing Norrland deduction. That closed a subsidy. It did not change which level of government gets paid.24
The displacement argument needs stating carefully, because it is conditional. Where grid capacity is not scarce, a data centre takes nothing from anyone. Where it is scarce — the regime this chapter has already described in west London and in the Swedish connection queue — a megawatt allocated to computation is a megawatt not allocated to something else, and the arithmetic above says what the something else would have employed. That is an opportunity cost under a binding constraint, not a general claim, and it depends on the displaced load actually having been built. Connection queues are full of projects that never are.
Against all of this sits the best evidence on the other side, and it is good evidence. Brookings, comparing 93 American counties that received their first large data centre between 2008 and 2024 against some 3000 control counties, found total private employment 4 to 5% higher within five to six years, construction up 11%, information-sector work up 22%, and wages 3 to 4% higher. Three qualifications come with it. Naive before-and-after comparisons overstate the effect roughly threefold. The gains fall to hyperscale counties and not to colocation ones, which showed no significant information-sector growth at all — that, rather than the 23% in counties with four or more facilities, is where the concentration shows, since 23% against a 22% average is barely a difference. And construction is the largest employer a data centre ever has, for the two or three years it lasts. None of that is unique to computation: Swedish industry generates about 1.1 indirect jobs for every direct one, so a smelter’s 470 employees stand for something closer to 1000 — a figure that belongs beside the data centre’s own indirect employment, which nobody in this section has counted, and not divided back into the 1.6 TWh.25
What the electricity is made of
Almost nothing in this chapter so far has been about carbon at the scale of a power station — the per-prompt section gives a figure for one query and nothing since — and it needs to be, because what a kilowatt-hour emits depends on what got built to supply it.
Two projects mark out the range. Constellation is restarting the undamaged reactor at Three Mile Island, closed in 2019 as uneconomic and renamed the Crane Clean Energy Center: 835 MW, back in service in 2027, under a twenty-year power purchase agreement with Microsoft and a $1 billion federal loan. That is about as clean a megawatt-hour as exists, and it is genuinely additional, because the plant would otherwise have stayed shut.
The other is on the site of Pennsylvania’s largest coal station, which closed in July 2023. Homer City Redevelopment is putting up to 4.4 GW of gas turbines there to serve a data-centre campus, with the first turbines arriving in 2026. The developer says the plant will emit 60 to 65% less CO2 per megawatt-hour than the coal station it replaces, which is what switching from coal to a modern combined cycle does.
Put that saving next to the capacity and it disappears. The coal station was about 1.9 GW net. The gas campus is 4.4. At round figures of 900 g of CO2 per kWh for the coal plant and 350 for the gas, both flat out, the coal station put about 1700 tonnes of CO2 into the air an hour and the gas campus will put about 1500. The gain per unit very nearly cancels against a plant 2.3 times the size. The two will also not run alike: the coal station closed because it could not sell its output, while a plant contracted to a data centre runs continuously. Over a year at 85% of the time, 4.4 GW makes 33 TWh and about 11 million tonnes of CO2 — more electricity than National Grid projects for the whole of British data-centre demand in 2030, and eight times what Swedish data centres use today, out of one campus.
The per-person arithmetic is milder, as it usually is. At the American grid’s 2023 average of 368 g of CO2 per kWh, an American’s 1.4 kWh/d of data-centre electricity carries about 0.5 kg of CO2 a day, or 190 kg a year.26
The two projects together are the honest picture. Demand on this scale gets served by whatever can be built at the density and the speed it wants, and the section on land gives the density: about 290 W/m2. Gas meets it on the site. Nuclear meets it where a mothballed reactor happens to be standing with a grid connection already attached. Wind at 2 W/m2 and solar at 11 cannot, so they have to be bought elsewhere and carried — which puts the problem back in the connection queue.
Europe: the offtaker who keeps the reactor open
On 9 September 2026 Google announced €13 billion over two years for data centres at four Finnish sites — Hamina, where it has been since 2009, and new ones at Kajaani, Muhos and Vaala — and on the same day what it had bought to run them. A 22-year power purchase agreement with Fortum for the Loviisa nuclear plant, taking 50% of its capacity from 2030 to 2049; 629 MW of new-to-grid onshore wind, from Valorem and Suomen Hyötytuuli; and a 94 MW battery near Kajaani from late 2027.
Loviisa is two VVER-440 reactors of 507 MW net each, 1014 MW together. It made 8.2 TWh in 2021 and is about 10% of Finland’s electricity. The announcement says the plant would otherwise have ceased operating in 2030, and that wants one correction. The regulatory permission to run to 2050 has existed since February 2023, when the Finnish government granted new operating licences replacing ones that expired in 2027 and 2030. What did not exist was the money: the licence is conditional on a €1 billion refurbishment programme, and Fortum’s position is that it could not commit to that spending without long-term revenue. The 2030 shutdown the deal averts was a commercial prospect, not a legal deadline — which makes the agreement more interesting rather than less, because it is a clean case of capital, and not permitting, being the binding constraint on keeping a working reactor alive.
Read what the money does, because it is not quite what the announcement sounds like. Google is not building a power station. Fortum is spending the €1 billion; Google is promising to buy half the output for twenty years. What the wealth buys is not plant but certainty, and certainty was the input the plant was short of. A life extension is a large cost paid now against revenue spread over two decades, which is the shape of investment a merchant market with Nordic price volatility finances badly and a twenty-year contract finances well. It did not add a megawatt of capacity. It prevented the subtraction of 1014 of them — worth as much, and a different sentence.
Now the arithmetic, which is the part the announcement leaves to the reader.
- Half of Loviisa is about 4.1 TWh a year.
- 629 MW of onshore wind at a capacity factor of 35%, fair for modern Finnish turbines, is about 1.9 TWh a year.
- Together, about 6 TWh a year: 680 MW running continuously, 7% of Finnish electricity, and 2.9 kWh/d for every Finn — twice what the table at the head of this chapter gives an American for the entire American data-centre fleet, contracted by one company in one country.
Set that against the load. The study Google commissioned alongside the announcement models a hypothetical 1 GW of demand sited in the Oulu–Kajaani region, and finds it would save Finnish consumers €520 million over twenty years by sitting where the grid is strong. A gigawatt run at the 85% this chapter uses elsewhere eats 7.4 TWh a year. The contracted supply covers about 80% of it, which is close enough to Ireland’s new legal minimum to be worth the next section.
The battery is the one number that shrinks on inspection. 94 MW is a power, not a store, and no energy capacity was published; at a typical two hours it would hold 188 MWh, which is eleven minutes of a 1 GW campus and 0.08% of a Finnish day’s electricity. It is a device for riding through a frequency event and arbitraging an evening, not for carrying a data centre through a windless week. Chapter 26’s arithmetic is unmoved by it.
The land is the number that behaves better in Finland than anywhere else in this chapter. The wind farms average about 220 MW, which at chapter 4’s 2 W/m2 wants roughly 110 km2. Finland has about 60 000 m2 of land per person against Britain’s 4000, so 110 km2 is a fifteenth of what the same power costs in British land shares. That, and not the tax rate, is what “smart siting” mostly means.27
Finland committed more than its own scenarios assumed
That was one company. Put it next to the country, and the country turns out to have committed more computing than its own official arithmetic ever assumed it would.
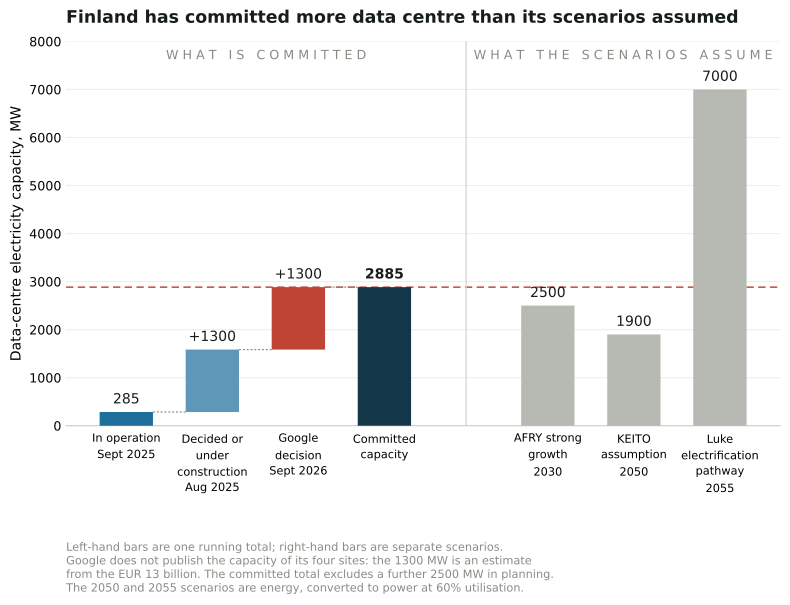
Figure 11a.2. Finnish data-centre electricity capacity, in megawatts of grid connection rather than the IT capacity figure 11a.1 counts. The four bars on the left are one running total: what was operating in September 2025, what had an investment decision or was under construction at the end of August 2025, and an estimate of the four sites Google announced in September 2026. The three on the right are separate scenarios, the last two being annual energy converted to power at 60% utilisation. The committed total excludes a further 2500 MW at planning and feasibility stage. Redrawn after a chart by Ilkka Hannula (Carbon Economics, 2026, CC BY 4.0), with four of the seven bars since checked against their own sources.28
Finland had 33 data centres and 285 MW between them in September 2025 — the census in the government rapporteur’s report, counting facilities above 1 MW and leaving cryptocurrency mining out. The Confederation of Finnish Industries’ investment dashboard, read at the end of that August, held 1300 MW with an investment decision or already starting up, about €8 billion, due for completion by 2027; behind it stood another 2500 MW and €21 billion at planning or feasibility stage, which is in no total here. Google’s four sites are in neither number. The company does not publish their capacity, and the 1300 MW in the figure is Helsingin Sanomat’s estimate from the €13 billion — a bar inferred from a price, and the softest one in the chart.
That makes 2885 MW committed, and the scenarios written to bound it have been passed already. AFRY’s strong-development case, run for the same rapporteur, puts Finnish data centres at 2500 MW in 2030 against a baseline of 1200. The KEITO scenarios underneath Finnish energy and climate policy assume the fleet reaches about 10 TWh a year by 2050, which is 1900 MW at the utilisation this figure converts by. The high case for 2030 was passed in 2026 and the assumption for 2050 by half as much again, with 2500 MW more in planning that nobody has counted. Only Luke’s pathway, in which Finland has electrified everything by 2055, is larger.
Now the conversion this chapter keeps insisting on, because capacity is not consumption. Finnish tax records put data-centre electricity at 1.3 TWh in 2024, and 285 MW running all year would be 2.5 TWh. The built fleet draws about half its nameplate — 52%, near enough the 60% the figure uses for the scenarios and a long way under the 85% this chapter uses for a campus built to train models. Which one you pick decides the answer. At 52% the committed 2885 MW would meter 13 TWh, 16% of Finnish electricity, 6.4 kWh/d for every Finn; at 85%, 21.5 TWh, 26%, and 10.5 kWh/d. Both ends are above the 3.6 kWh/d this chapter gives Ireland, the country it calls the future arriving early — and Ireland and Finland have almost exactly the same number of people to divide by.
Figure 11a.1’s forecast for Finland can be checked against this, and it does not hold. That chart has Finnish capacity at 2.7% of the national peak now and 9.0% by 2031. The peak is 15 553 MW, met on the evening of 8 January 2026 at a consumption-weighted −19 °C, a Finnish record and a larger denominator than the 2025 peak that chart divides by. The committed 2885 MW is 19% of it — twice the forecast for 2031, five years early, on the reading that flatters the forecast. The two are not quite the same quantity, because that chart counts IT capacity and this one counts the connection the building is wrapped around, which is larger by the cooling and the losses, perhaps a fifth. Take the fifth off and it is 15%, still well past a forecast for 2031.
Two things follow for the deal above. The first is that the “about 80%” is softer than it looked. It sets 6 TWh of contract against a modelled gigawatt run at 85%. If Google’s Finnish sites are the 1300 MW Helsingin Sanomat estimates, the same 85% wants 9.7 TWh and the contract covers 62%; at the 52% the existing Finnish fleet runs at, it wants 5.9 TWh and the contract covers all of it. The coverage ratio is an artefact of an assumption about utilisation rather than a measurement, and nobody outside the company can settle it.
The second is the price. AFRY’s analysis assumed new onshore wind built to match the data centres’ annual energy demand — precisely the annual matching this chapter’s closing section is about — and still found that going from 1200 to 2500 MW raises Finland’s average annual electricity price by more than 10%, with price spikes higher and more frequent. A year’s worth of wind does not buy a windless Tuesday. The same report asked what the machines might give back, and answered it: some Finnish data centres already sell fast frequency reserve to Fingrid, which is flexibility measured in seconds and minutes, and they cannot provide flexibility over days or weeks. That is the last section of this chapter, answered in advance and in the negative.29
Ireland turned it into a rule
What Google did voluntarily in Finland, Ireland now requires. The Commission for Regulation of Utilities published its Large Energy User connection policy in December 2025: a data centre seeking a connection of 1 MVA or more must procure new, additional renewable generation in Ireland equal to at least 80% of its annual demand, reached on a glide-up within six years of energisation, with the system operators to publish the process by 31 March 2026.30
Ireland is the country in this chapter’s table at 22% of national electricity and the one whose grid operator had to stop connecting Dublin. It has arrived, by regulation, at the position an offtaker in Finland reached by contract: if you want the electrons, bring the plant.
The gap between the rule and the deals is the thing to look at. Amazon, the most active corporate clean-power buyer in Europe, has contracted about 310 MW of Irish generation against a stated ambition of 800 MW; Microsoft has signed for three Irish onshore wind farms totalling about 80 MW. At a 30% capacity factor those are 0.8 TWh and 0.2 TWh a year, against the roughly 7 TWh Irish data centres already meter. Twelve per cent and three per cent. The rule binds new connections rather than the installed fleet, so this is not a charge of non-compliance; it is the distance between what has been announced and what a fleet of this size would need, and it is more than a factor of five.
Britain got the same site and gave a different answer
The paragraphs above described Homer City: a dead Pennsylvania coal station, its grid connection still attached, being rebuilt as up to 4.4 GW of gas turbines with the computing to absorb them. Britain has the identical starting condition and has so far chosen differently.
At Cottam in Nottinghamshire, another closed coal station, Holtec International, EDF UK and Tritax have a memorandum of understanding to build a 1 GW data centre on about 900 acres, powered mainly by renewables at first and by Holtec SMR-300 reactors in the 2030s. Run at 85%, a gigawatt over 3.6 km2 is about 230 W/m2 — against Homer City’s 290, on the same basis. The density is the same to within a quarter; the carbon is not. Both projects are doing what the section above says demand at this density forces: taking a site where the wires already are. The difference is only what gets connected to them, and in Britain’s case the thing that gets connected does not exist yet — Rolls-Royce SMR, the other British programme, will not deliver before 2030, and OpenAI paused its Stargate UK project in April 2026 citing regulation and the cost of energy.31
What the deals add up to
Corporations contracted 55.9 GW of clean power worldwide in 2025 — the second-largest year on record and 10% below 2024, the first fall in nearly a decade. EMEA fell 13%, to 17 GW. Meta, Amazon, Google and Microsoft were 49% of the global total between them, Meta at 10.24 GW and Amazon at 10.22 GW, with Amazon the most active buyer in Europe.32
Do MacKay’s check on that. Half of 55.9 GW is about 27 GW of nameplate, which at a blended 30% is roughly 72 TWh a year of output — against the 415 TWh this chapter gives for world data centres in 2024. One year of buying by four companies is of the order of a sixth of the fleet’s electricity. Four or five such years would cover it, if every megawatt were additional and every one of them landed on the grid that needed it.
Neither condition holds, and the second is the one this book keeps returning to. A wind farm contracted in Finland does not run a server in Ireland at three in the morning in a windless week. Annual matching — buying as many megawatt-hours over a year as you consume — is the standard these figures are reported against, and chapter 26 is one long argument that annual totals are the wrong unit. Which is exactly why the Loviisa agreement is the interesting one in this section. A reactor delivers at three in the morning. An offtaker that wants power at every hour and can pay for two decades of it will end up paying for the kind of plant that runs at every hour, whatever it says in its renewable-energy reporting — and in Finland it did.
What it means for the balance sheet
MacKay’s summary figure for chapter 11 is 5 kWh/d for a houseful of gadgets. Data centres are not in that number in any meaningful way — his 0.4 kWh/d for America was a footnote.
On today’s American figures they would add about 1.4 kWh/d per person, and on the 2028 projection something between 2 and 4. That is not enormous beside heating’s 37 or driving’s 40. But it is new demand, arriving fast, in the one form the system finds hardest to accommodate: electricity, constant, and inflexible.
And it changes an argument the book makes elsewhere, in the way the grid-position note under What is hidden describes. Chapters 26 and 28a are about a system where the difficulty is that supply fluctuates and demand does not follow. A data centre is demand that could follow — computation can in principle be moved in time and space more easily than heat or transport can — but is currently built to run flat out because the capital cost of the hardware dwarfs the electricity. If that ever changes, the largest new load on the grid becomes the largest new source of flexibility. Nothing in the physics forbids it. The economics, so far, point the other way.
Notes and further reading
The European Union row is the Commission’s report COM(2026) 500, On the energy efficiency of data centres in the EU, 21 September 2026, which gives 68 TWh for 2024 and 114 TWh, 3.2% of Union electricity, for 2030, both from the International Energy Agency. The 2.5% share for 2024 is this edition’s, against EU electricity demand of 2727 TWh in 2024 from Ember’s European Electricity Review 2025; the per-person figures use an EU population of 449.2 million, which gives 0.415 kWh/d for 2024 and about 0.70 for 2030 at an unchanged population. The IEA’s boundary for “data centre” is not the same as the reporting scheme’s, and neither is the same as the British boundary argued over above.↩︎
Global data-centre electricity of 415 TWh in 2024, about 1.5% of world electricity, is from the International Energy Agency’s Energy and AI (2025). The American figure of 176 TWh and 4.4% of national consumption in 2023, excluding cryptocurrency mining, is from Lawrence Berkeley National Laboratory’s 2024 United States Data Center Energy Usage Report, prepared for the Department of Energy. Irish figures are from the Central Statistics Office: data centres took 22% of metered electricity in 2024, against 5% in 2015. Per-person figures here are computed by dividing by populations of roughly 8.2 billion, 335 million and 5.4 million; they are shares of national consumption, not a claim about what any individual uses, since much of the computation serves users in other countries. That last point matters for Ireland especially, where the data centres largely serve Europe rather than Ireland, so the electricity is Irish and the service is not.↩︎
Swedish data-centre electricity of 4.0 to 4.4 TWh in 2025 is the Swedish Energy Agency’s (Energimyndigheten), with the agency’s own caveat that the estimate was made before demand for AI hardware accelerated and may therefore be low. The projection of 14 to 15 TWh by 2030 is Svenskt Näringsliv’s, the Confederation of Swedish Enterprise. A figure circulating for SE3 alone — 1310 MW of AI-data-centre applications in 2024 against 6692 MW in 2025 — is not used here, because a single bidding zone counting only AI facilities cannot exceed the national all-data-centre total of about 4500 MW that the queue section gives, on the authority of the connection-queue note below, and this edition could not establish which of the two bases the SE3 number is on. It is recorded in this note rather than the text so that a reader who meets it elsewhere knows it was considered and set aside. Shares and per-person figures are computed here against Swedish electricity consumption of about 140 TWh and a population of 10.6 million, the 140 TWh being the figure this chapter’s jobs section also uses, and the population from Statistics Sweden. Three cautions. Svenskt Näringsliv is an employers’ organisation with a position on electricity supply, and a 2030 projection made during a construction boom is the least reliable class of number in this chapter — the same caution the growth section applies to the American projections applies here with more force, since the Swedish series is shorter. Connection applications are not commitments, as the later section on the queue says at more length: a large share of any queue is speculative or duplicated, so the 9000 MW measures interest rather than plant. And the Irish comparison in the text is between a measured present and a projected future, which is a comparison of two different kinds of number even though both are expressed in kWh/d.↩︎
British estimates differ by more than a factor of two, and the difference is definitional rather than empirical. The commonly quoted figure is about 2.5% of UK electricity for data centres proper; a 2026 assessment reported in the engineering press put the UK and US both near 6%, on a boundary that includes more of the wider digital infrastructure. Neither is wrong; they are answering different questions, and this edition quotes the range rather than choosing. National Grid’s Future Energy Scenarios 2025 gives a ten-year forecast of 5.2 GW and just over 20 TWh a year by 2030. Per-person figures use a population of 68.4 million and UK electricity consumption of roughly 280 TWh. Note that the American 4.4% figure excludes cryptocurrency mining while some British figures may not, which is part of the gap.↩︎
Swedish connection-application figures are from Dagens Infrastruktur, 17 June 2026, as compiled in section 8 of the elmix references: about 9000 MW applied for in 2025, roughly half of it data centres, concentrated in Mälardalen, Stockholm, Uppsala and Gävleborg, with Microsoft’s Sandviken project paused. Applications are not commitments — a large share of any connection queue never gets built, and queues are known to contain speculative and duplicate requests — so the figure indicates pressure on the queue rather than load that will certainly arrive.↩︎
Figure 11a.1 is drawn from values read off a published chart, “How material could data centres become for Europe’s power systems?”, circulated by ARdS in 2026, which states its sources as the EUDCA European Data Centre Market Monitor 2025 for capacity and the ENTSO-E Statistical Factsheet 2025 for peak load. This edition has not seen the Market Monitor itself, so these numbers are quoted at second hand and the note says so rather than presenting them as read from the primary source. The quantity is total data-centre IT capacity, colocation plus hyperscale-owned, as a percentage of 2025 national peak electricity load, with both years measured against the 2025 peak. Three cautions. Nameplate IT capacity is not electricity consumed and is not spare capacity, which the source chart says in its own note; the conversion between the two needs national peak load, the fraction of installed capacity actually running, and the facility’s own overhead, and those are not published together for any of these countries. The load-factor arithmetic in the body is this edition’s, using a round 0.6 for a European grid’s ratio of average to peak load, and is meant to show the direction of the gap rather than to size it. The 2031 column is a forecast made during a construction boom, and the queue sections below give the reasons a pipeline overstates what gets built — the same caution this chapter applies to the American and Swedish projections. And the United Kingdom is absent from the source. National Grid’s 5.2 GW by 2030, quoted above, is grid connection capacity rather than IT capacity and would sit on a different denominator, so it is not filled in here.↩︎
Growth rates and the 2028 range are from the Berkeley Lab report: about 7% a year 2014–2018, about 18% a year 2018–2023, and 13–27% a year projected 2023–2028, giving 325–580 TWh or 6.7–12% of US electricity. The global 2030 projection of about 950 TWh, roughly 3% of world electricity, and the AI shares — 24% of server electricity and 15% of data-centre energy in 2024, rising to 35–50% of data-centre power by 2030 — are the IEA’s. All of these are projections made during a capital-investment boom, and projections made during booms have a poor record; the 2028 range spanning nearly a factor of two is the honest reflection of that. The claim that efficiency absorbed growth until about 2018 is the standard reading of the Berkeley Lab series and of Masanet et al. (2020), which found global data-centre energy roughly flat from 2010 to 2018 despite a sixfold rise in compute.↩︎
Google’s per-prompt figures are from “Measuring the environmental impact of AI inference”, Google Cloud blog, 21 August 2025, and the technical paper behind it: a median Gemini Apps text prompt at 0.24 Wh of energy, 0.03 gCO2e and 0.26 ml of water, with a stated 33-fold fall in energy and 44-fold fall in total carbon footprint over the preceding twelve months. Three things about that boundary. It counts the accelerators, the host system, idle capacity held in reserve and data-centre overhead, which is wider than most published estimates and is why the figure can be set against national totals at all. It excludes training. And “median” is doing real work: the distribution of prompt cost is long-tailed, so the median sits far below the mean, and Google has not published the mean. The comparison figure is Stephen Witt’s, “Inside the Data Centers That Train A.I. and Drain the Electrical Grid”, The New Yorker, 27 October 2025, https://www.newyorker.com/magazine/2025/11/03/inside-the-data-centers-that-train-ai-and-drain-the-electrical-grid: about 5000 tokens for a college term paper, using “enough electricity to run a microwave oven at full power for about three minutes”. The conversion to watt-hours is this edition’s, not Witt’s: a domestic microwave is rated near 800 W of output and draws roughly 1.2 kW at the wall, giving 40 to 60 Wh for three minutes. Witt states no method, so this is a journalist’s order-of-magnitude figure set beside an operator’s measured one rather than two competing measurements. The consistency check in the body uses this chapter’s own 1.4 kWh/d and the Berkeley Lab 15% AI share, both of which carry their own uncertainty; what the check is good for is the direction of the gap, not its size.↩︎
Water usage effectiveness figures: an industry average near 1.8 litres per kWh, against Amazon Web Services’ reported global fleet average of 0.19 L/kWh. Virginia consumption of over 2.1 billion US gallons in 2023, with Loudoun County near 900 million, is from state and county reporting compiled by the Center for Secure Water at the University of Illinois and others. Two cautions. WUE varies by more than an order of magnitude with cooling design and climate, so a single global multiplication is indicative only — the 750 million cubic metre figure in the text should be read as an order of magnitude, not an estimate. And water withdrawn is not water consumed: evaporative cooling consumes most of what it takes, while some designs return most of it, and public reporting rarely distinguishes the two.↩︎
Homer City site area of more than 3200 acres and capacity are from Homer City Redevelopment’s own project overview, which gives “up to 4.4 GW”; the April 2025 announcement with Kiewit and GE Vernova gives 4.5 GW from seven GE Vernova 7HA.02 turbines, and trade reporting a capital cost near $10 billion. This edition uses the developer’s current 4.4 GW and records the discrepancy. 3200 acres is 12.95 km2. Basis matters here and the body states it: 4.4 GW over the whole site is 340 W/m2 of capacity, which is not comparable with chapter 4’s 2 W/m2 or chapter 6’s 11, both of which are average delivered power. At the 85% capacity factor used elsewhere in this chapter the campus averages 3.74 GW, or about 290 W/m2, and that is the figure the body compares and the one the 1900 km2 and 470 000 people are derived from. Comparing the capacity figure instead would inflate every one of those by about a fifth. The 290 is also the density of a paired plant and campus, not of a data hall: the site carries the generation as well as the computing, and not all of it will be built on. The comparisons are with this book’s own figures — chapter 4’s 2 W/m2 for British onshore wind, chapter 6’s derived 11 W/m2 for Cleve Hill in Kent, and chapter 4’s 4000 m2 of British land per person. The topsoil account is one farmer’s, reported by Witt in the New Yorker piece cited above, and stands here as testimony rather than measurement.↩︎
European Commission, “Commission enhances energy efficiency and sustainability of data centres in the EU”, press release IP/26/1667, 21 September 2026, with the accompanying questions and answers of the same date. The rating scheme is a delegated regulation under the Energy Efficiency Directive (EU) 2023/1791, complementing the reporting scheme of Delegated Regulation (EU) 2024/1364; it is subject to two months’ scrutiny by the European Parliament and the Council, which may object but not amend, and a first review is foreseen by the end of 2028. The 500 kW threshold is that of Article 12 of the Directive, which obliges operators above it to report. Its dimensions, per the Commission’s questions and answers: power use efficiency, water use efficiency, use of low-emission sources, grid functions and waste-heat reuse readiness, and whether the operator has contracted new clean generation — power purchase agreements with renewable or nuclear plants not older than ten years or substantially refurbished within them. The label is to be produced automatically from the European database, which is to say from the operator’s own reported figures. The consultation on minimum performance standards closes 14 December 2026. The findings in the text are from COM(2026) 500 and the technical study behind it (AIT, Borderstep and EY, 2025), covering the first reporting period, May to September 2024: 770 reporting sites, about 36% of the estimated total under the obligation, with six member states reporting none and five fewer than three; 70.1% of the reported data judged reliable; energy-weighted average PUE 1.36 across 681 sites with reliable values (1.64 for sites of 500 to 1000 kW); WUE 0.58 L/kWh across 458 sites, national averages 0.07 to 1.28; energy reused about 1.8%, from 67 sites reporting any reuse, a figure the report itself flags as possibly unrepresentative in both directions; renewable energy factor 0.86 across 584 sites. The Commission notes it has preliminary data from at least 30% more sites for the second period, which will change these averages, probably upward in water and downward in renewables, since late reporters are unlikely to be the leaders. The four-million-homes arithmetic is this book’s check on the press release: 34 TWh over four million households is 8.5 MWh each.↩︎
The price channel and the demand fork are set out with sources in the elmix cannibalization model, section 2 of https://oluies.github.io/elmix/modell/referenser.html. The argument that data centres outbid industry because electricity is a small share of their cost is Pär Holmberg’s; the revenue-per-kilowatt-hour comparison, roughly 80–100 SEK/kWh for hyperscale AI against a few SEK/kWh for power-intensive industry, is Jonas Kristiansen Nøland’s. The Anthropic–xAI figure is derived from a reported commercial arrangement — roughly 300 MW for about $1.25 billion a month — which is $5.71 per kWh if the capacity runs continuously, and should be treated as an order-of-magnitude indication from a single reported deal rather than an industry rate. Currency conversions throughout this section use approximate mid-2026 rates of 9.6 SEK, 0.79 GBP and 0.92 EUR to the US dollar, rounded to two significant figures; they are given so the reader can weigh the number against prices in their own currency, not as precise valuations, and the SEK figures in the underlying Swedish analysis are the primary ones there. PJM capacity auction figures, a roughly tenfold rise with data centres accounting for 63% of the 2025/26 increase, are from the same section. The EU demand figures — data centres about 70 TWh in 2024 rising to about 115 TWh by 2030 at roughly 15% a year, against a technical potential near 600 TWh for electrified industrial heat — are likewise sourced there.↩︎
The west London constraint was identified by the Greater London Authority in summer 2022 across Ealing, Hillingdon and Hounslow, with effects extending to Slough and Egham, and reported as potentially blocking new housing connections until 2035. Subsequent progress — 3315 permitted homes unlocked from March 2024 through the network operator’s capacity-allocation study, and at least 11 690 permitted homes released in total with City Hall involvement — is from the GLA’s own reporting on west London electricity capacity constraints. The data-centre industry has publicly contested the attribution, arguing that long-run under-investment in distribution networks is the underlying cause and that data centres were simply the first large load to expose it. That argument has force: the episode shows a queue allocating scarce capacity, not a technology consuming more than its share.↩︎
Swedish connection-application figures are from Dagens Infrastruktur, 17 June 2026, as compiled in section 8 of the elmix references: about 9000 MW applied for in 2025, roughly half of it data centres, concentrated in Mälardalen, Stockholm, Uppsala and Gävleborg, with Microsoft’s Sandviken project paused. Applications are not commitments — a large share of any connection queue never gets built, and queues are known to contain speculative and duplicate requests — so the figure indicates pressure on the queue rather than load that will certainly arrive.↩︎
Svenska kraftnät, Se över anslutningsprocessen till elsystemet och tillträdet till elmarknaden, report on a government assignment, ärendenummer Svk 2025/5008, dated 29 April 2026 and delivered to the Ministry of Climate and Enterprise on 30 April, 57 pp., https://www.svk.se/4992b2/siteassets/om-oss/rapporter/2026/rapport_-regeringsuppdrag-om-att-se-over-anslutningsprocessen-till-elsystemet-och-tilltradet-till-elmarknaden-.pdf. All translations here are this edition’s, and all emphasis in the quoted matter is added. The finding in the blockquote is the report’s own: the transmission connection process “innehåller inte någon uttrycklig värdering av hur en anslutning påverkar olika former av systemnytta, trots att sådana effekter har direkt betydelse för både elsystemets totala kostnader och dess leveranssäkerhet”. The capacity-zone proposal appears in two forms, for particular customer categories and for system benefit, and of each the report says the same thing: introducing it “kräver ytterligare arbete innan ett färdigt förslag kan presenteras och en första zon kan etableras. Detta omfattar både fortsatt intern utveckling av processens utformning och fördjupad dialog med regionnätsföretag och branschens aktörer” — so this is a direction of travel rather than a rule in force. The observation about data centres is likewise the report’s: certain categories appear “betydligt mindre beroende av elpriset för att generera en god ekonomisk avkastning och kan därmed antas vara mindre benägna att anpassa sin elanvändning”. The European guidance is the Commission notice Guidance on efficient and timely grid connections, adopted as C(2025) 8473 final on 10 December 2025 as part of the European grids package and published in the Official Journal as C/2025/6703; the Swedish report dates it 19 December 2025, which is the publication rather than the adoption. It is not legally binding, and the report says so — it exists to support consistent application of rules that are. One caution on how this is often summarised, and one on chain of custody. It is tempting to read the guidance as putting system benefit ahead of data centres, and the report does not say that: it renders the Commission’s examples of frameworks that may prioritise on economic or political grounds as “elektrifiering av transport, industri eller etablering av datacenter”, with data centres named as a permissible target rather than a disfavoured one. That Swedish phrase is Svenska kraftnät’s own summary — the report introduces it with “Kommissionen pekar vidare på att”, the Commission points out that — and is not presented by the report as a quotation. This edition has not obtained the notice’s English text, so the English in the body is a translation of a summary and is marked as such rather than attributed to the Commission as its wording. What is being licensed, on either reading, is prioritisation itself.↩︎
New York: Executive Order No. 62, “Establishing a Temporary Moratorium on Data Centers in New York While the State Develops Higher Standards for Data Center Development and Benefits Blueprint to Support Localities”, signed 14 July 2026, https://www.governor.ny.gov/executive-order/no-62-establishing-temporary-moratorium-data-centers-new-york-while-state-develops; it pauses state environmental permits for facilities of 50 MW and above for up to one year while a generic environmental impact statement is prepared. Texas: Governor Abbott’s direction of 3 August 2026 to the Public Utility Commission of Texas and ERCOT to carry out a verification and audit of data-centre projects in the interconnection process, in response to which ERCOT paused interconnections; the figure of about 1800 projects in the queue and BloombergNEF’s estimate of 49.8 GW at risk of delay, near a fifth of the American pipeline, are from contemporaneous trade reporting rather than from the order itself. Pennsylvania: Executive Order 2026-05, signed 18 August 2026, https://www.pa.gov/governor/newsroom/2026-press-releases/governor-shapiro-signs-executive-order-on-data-center-developmen. Two cautions. All three are executive actions rather than legislation and can be undone by the same means. And all three were days or weeks old when this was written, so what is recorded here is what was done, not what it turned out to cause.↩︎
Gallup, “Americans Oppose AI Data Centers in Their Area”, fieldwork 2–18 March 2026, 1000 US adults, margin of error ±4 percentage points, https://news.gallup.com/poll/709772/americans-oppose-data-centers-area.aspx. 71% opposed construction of an AI data centre in their local area and 48% were strongly opposed, against 25% in favour and 7% strongly in favour. Strong opposition ran at 56% among Democrats, 48% among independents and 39% among Republicans, with majorities opposed in every group. Opposition to a local nuclear power plant was 53% in the same survey. Half of those opposed cited water and energy use; 16% cited pollution. Note what the question asks. It is about a facility in the respondent’s own area, which is a different question from whether such facilities should be built anywhere, and the answers are not comparable with polling on data centres in general. The federal bills are S.4214, introduced by Senator Sanders on 25 March 2026, and H.R.9442, introduced by Representative Ocasio-Cortez on 24 June 2026 with nine cosponsors.↩︎
Gallup, “Americans Oppose AI Data Centers in Their Area”, fieldwork 2–18 March 2026, 1000 US adults, margin of error ±4 percentage points, https://news.gallup.com/poll/709772/americans-oppose-data-centers-area.aspx. 71% opposed construction of an AI data centre in their local area and 48% were strongly opposed, against 25% in favour and 7% strongly in favour. Strong opposition ran at 56% among Democrats, 48% among independents and 39% among Republicans, with majorities opposed in every group. Opposition to a local nuclear power plant was 53% in the same survey. Half of those opposed cited water and energy use; 16% cited pollution. Note what the question asks. It is about a facility in the respondent’s own area, which is a different question from whether such facilities should be built anywhere, and the answers are not comparable with polling on data centres in general. The federal bills are S.4214, introduced by Senator Sanders on 25 March 2026, and H.R.9442, introduced by Representative Ocasio-Cortez on 24 June 2026 with nine cosponsors.↩︎
Lucy Yu, The Grid We Need Now: Independent Review of AI Deployment in the Electricity Networks, September 2026, commissioned by the Department for Energy Security and Net Zero, with a review team drawn from the Energy Systems Catapult, Digital Catapult and the Alan Turing Institute; © Crown copyright 2026, Open Government Licence v3.0. The quoted phrase about hardcoding costs and the 2035/2036 dates are from the executive summary and Core Recommendation 1. The renewable-share figures are the review’s Figure 1, from NESO’s Historic GB Generation Mix: settlement periods per year in which wind and solar together exceeded 30% and 50% of GB generation, read here off the published chart, which also shows a dip in 2021 that the caption attributes to low wind speeds rather than to less plant. Balancing costs of £1.2 billion in 2018/19 and £2.7 billion in 2024/25, the £3.4–4.9 billion forecast for 2031–35 under two NESO Future Energy Scenarios, and constraint costs of £0.4 billion in 2019/20 and £1.7 billion in 2024/25 are the review’s, sourced there to NESO’s 2025 Annual Balancing Costs Report. The per-person conversion is this edition’s, at a population of 68.4 million, the same figure used elsewhere in this chapter. The four-fold rise in British data-centre electricity demand by 2030 is the review’s, citing Clark, Burnett, Stewart and Woodhouse, Data centres: planning policy, sustainability, and resilience, House of Commons Library, 27 May 2026, alongside an Oxford Economics estimate that compute demand more than doubles in the same period; the 30% growth in total British demand by 2035 is likewise the review’s. The £90 million is this edition’s addition of the review’s own worked examples and is not a figure the review states: about £20 million a year from Dynamic Line Ratings on 275 km of National Grid transmission line, a further £50 million over five years at 900 km (taken here as £10 million a year), about £30 million a year from NESO’s Dynamic Reserve Setting, and about £30 million a year in reserve costs from Open Climate Fix’s solar forecasting for NESO. Three cautions on that sum. These are the savings the review chose to quantify, not an inventory of AI’s value in the grid, and the review says explicitly that the full scale of savings from probabilistic operation is “extremely difficult to quantify” for a complex real-world grid. The items are on different bases — some are constraint costs, some reserve costs — and adding them is a rough indication of order rather than an accounting. And the 11% comes from Heylen, Ovaere, Proost, Deconinck and Van Hertem, A multi-dimensional analysis of reliability criteria, Electric Power Systems Research 167 (2019), on a 24-bus theoretical grid; the review cites it while stating that it cannot be reliably generalised to the GB grid, and it is repeated here with that caveat attached rather than as a British estimate. The out-of-scope statement is from the reviewer’s foreword.↩︎
The nodal price analysis is Bloomberg’s, “How AI Data Centers Are Sending Your Power Bill Soaring” (2025): wholesale prices at some nodes up to 267% higher in April 2025 than in April 2020, with more than 70% of the nodes that rose lying within 50 miles of significant data-centre activity. Rate-case totals are from PowerLines, which tracks American rate filings: about $31 billion requested across 2025, roughly double 2024. A second PowerLines figure is on a different boundary and the two should not be read as a series: more than $34 billion through the first three quarters counts requests plus approvals, and reaches 124 million billpayers. A request is not an increase, since regulators grant part of what is asked for; the body uses the annual requested figure and the approvals total is given only to show the number of households a rate case touches. The 267% is the maximum at any node. It is not an average, and it is not a retail rate. PolitiFact examined a claim by Senator Warren in June 2026 that data centres had raised American electricity bills by that much and found the figure did not support it. Utility rate increases have several drivers, studies disagree about how much of them data centres explain, and NPR has reported places where new large load reduced bills by spreading fixed network costs over more sales. The argument in the body does not turn on the size of the effect, only on marginal pricing being common to every buyer at a node.↩︎
Staffing ratios per megawatt are from iRecruit’s 2026 survey of data-centre staffing: 2.0–3.0 per MW at 1–5 MW, 1.75–2.5 at 5–20 MW, 1.0–1.5 at 20 MW and above, and 0.2–0.3 for ultra-hyperscale sites above 100 MW. The Google Kansas City campus, 200 permanent staff for 500 MW, is from the same source, which puts it at 0.4 jobs per MW — above the ultra-hyperscale band rather than inside it, and quoted here at its own figure. Staffing ratios are a weak statistic in one specific way: they count people employed at the site, and a hyperscale operator’s monitoring, security and software staff may sit in another country or another company. The direction of that bias is unknown, since it removes some jobs from the site’s count and adds others that a smelter would have contracted out too. The 85% load factor used to convert megawatts to energy is a round figure for facilities built to run flat out; the text of this chapter explains why they are.↩︎
Kubikenborg Aluminium’s workforce of about 470 and its annual production of about 135 000 tonnes of primary aluminium are from Sveriges Television. Its electricity use is not published directly; it is derived from the company’s own statement that one öre per kilowatt-hour costs it 16 million kronor a year, which implies 1.6 TWh, and cross-checked against its separate claim to use about 1% of Swedish electricity. A third check, 135 000 tonnes at the 13–15 MWh per tonne typical of a modern smelter, gives 1.8–2.0 TWh, so the derived figure may be somewhat low and the resulting 3400 MWh per job-year somewhat generous to the smelter. The economy-wide figure of about 25 MWh per job-year is electricity consumption divided by total employment: roughly 140 TWh across 5.2 million employed in Sweden, and roughly 4000 TWh across 160 million in the United States, which land within a couple of MWh of each other. These are ratios of two aggregates, not a measure of any job’s electricity use, and the comparison is only meaningful because all three are computed the same way. The pulp and paper industry is deliberately left out: the 18 TWh figure commonly quoted covers the whole forest industry including sawmills, while the 19 000 employees commonly quoted alongside it covers pulp and paper alone, and dividing one by the other mixes two boundaries.↩︎
The 23 000 estimate, its share of American employment, and the critique of the industry figure are from Food & Water Watch, Artificial Jobs: The Illusion of Big Tech’s Data Center Employment Claims, January 2026. The 4.4% electricity share is the Berkeley Lab figure for 2023 cited there, while the employment estimate is for 2024. Food & Water Watch is a campaigning organisation calling for a moratorium on data-centre construction, and the PricewaterhouseCoopers report was commissioned by the Data Center Coalition, an industry body; neither is disinterested, which is why the definitional point rather than either total is what this section rests on. The Virginia comparison — about a third of national capacity against 4% of national 518210 employment — is the part of the argument that does not depend on trusting either side’s total. The separate figure of 1.12 jobs per MW comes from Virginia’s growth in 518210 employment of 2148 against 1910 MW of data-centre capacity connected by Dominion Energy in 2023 and 2024.↩︎
The energy-tax reduction for datorhallar, introduced in 2017, was abolished with effect from 1 July 2023, decided by the Riksdag in December 2022 on the government’s proposal in the budget bill for 2023 (prop. 2022/23:1); see Skatteverket, “Slopad skattenedsättning för datorhallar”. The stated reason was to give data centres an incentive to use electricity more efficiently under changed European market conditions. The Norrlandsavdraget, a standing reduction for electricity consumed in certain northern municipalities, is separate and continues to apply. The description of municipal finance here is the ordinary Swedish arrangement — kommunalskatt is levied on the income of residents, while corporation tax and energy tax accrue to the state — and is given because it explains why a municipality’s interest in a large employer differs from the state’s interest in a large investment.↩︎
Employment effects are from Brookings, “New evidence on data center employment effects”, which links about 770 American facilities to county employment data for 2003–2024 and applies the synthetic control method to 93 counties receiving their first large facility between 2008 and 2024, against roughly 3000 controls. The stated caution that naive comparisons overstate the effect about threefold matters, because data-centre counties were already growing faster than their neighbours before the facilities arrived. The Swedish employment multiplier of 1.1 indirect jobs per direct job, giving a total multiplier of 2.1, is from Industriarbetsgivarna’s 2023 analysis by Industriekonomerna. It is not applied to either side of the MWh-per-job-year comparison: every such figure in this section, for the data centre and for the smelter alike, counts direct employment only. The ~1000 in the text shows what the multiplier would do to one side if it were applied, and is not to be divided back into the smelter’s 1.6 TWh. No published equivalent for data centres was found, which is itself a reason to leave both sides direct. Two of these findings are in tension and the tension is not resolved here: county-level employment rises where data centres are built, while the facilities themselves employ very few people. Construction, the information-sector cluster effect, and the ordinary economic activity of a large capital investment are the candidate explanations, and the Brookings authors favour the cluster effect. What the per-megawatt arithmetic establishes is narrower than the county result contradicts: it is a statement about operating employment per unit of electricity, not about the total economic effect of building the thing.↩︎
Crane Clean Energy Center: 835 MW, restart expected in 2027, from Constellation’s own page, https://www.constellationenergy.com/about/locations/crane-clean-energy-center.html; the twenty-year power purchase agreement with Microsoft was announced in September 2024 and a $1 billion Department of Energy loan followed in 2025. The unit is Three Mile Island Unit 1, which shut in 2019 for economic reasons; it is not the unit damaged in 1979, which stays dormant. Homer City Generating Station’s coal capacity is reported variously as 2022 MW nameplate and about 1884 MW net across three units, and it closed in July 2023. The emission arithmetic is this edition’s. It uses round figures of 900 g CO2/kWh for a subcritical coal station and 350 g/kWh for a modern combined cycle; the ratio of those two reproduces the developer’s own claim of a 60 to 65% reduction per megawatt-hour, which is a check on the assumptions rather than an independent source for them. The hourly figures assume both plants at full output. The annual figure assumes the gas campus at 85% capacity factor, which is what a plant contracted to a data centre would be expected to run at and is well above what the coal station managed in its last years. It is a ceiling twice over, since the developer says “up to” 4.4 GW and 85% is a high load factor, so 33 TWh and 11 Mt should be read as what the campus could do rather than what it will. The American grid average of 368 g CO2/kWh is derived from the EIA’s 0.81 pounds of CO2 per kWh for 2023 — 1.53 billion tonnes from 4.18 trillion kWh — at https://www.eia.gov/tools/faqs/faq.php?id=74&t=11. Applying a national average to data-centre consumption simplifies in both directions: hyperscale operators contract for more clean power than the average buyer, while the gas plants being built to serve them are dirtier than the grid they join.↩︎
Google, “Google Deepens Commitment to Finland with Two-Year €13 Billion investment in AI Infrastructure”, 9 September 2026, https://blog.google/innovation-and-ai/infrastructure-and-cloud/global-network/clean-energy-finland/, with the terms of the Fortum agreement — 22 years, an offtake of 50% of Loviisa’s capacity from 2030 to 2049, in support of a life extension to 2050 — from contemporaneous trade reporting of the same announcement, including World Nuclear News and DataCenterDynamics. Loviisa’s two VVER-440 units at 507 MW net each, 1014 MW together, and output of 8.2 TWh in 2021 are Fortum’s and STUK’s; the €1 billion lifetime-extension programme is Fortum’s own figure, given as investment to 2050. The correction in the body is this edition’s and matters, because the announcement does not make it. The Finnish government granted new operating licences for both units on 16 February 2023, valid to the end of 2050, replacing licences that expired at the end of 2027 for Loviisa 1 and the end of 2030 for Loviisa 2, on a positive safety statement from STUK; see the Ministry of Economic Affairs and Employment, https://tem.fi/en/-/fortum-granted-licence-to-operate-loviisa-power-plant-units-until-end-of-2050. So the 2030 date that appears in the announcement is the horizon Fortum’s own investment decision faced, not the expiry of a permission, and this edition has not seen a Fortum statement putting it more strongly than that. All the arithmetic in this subsection is this edition’s, and each step carries an assumption worth stating. The 4.1 TWh is half of a recent annual output, not half of a contracted quantity: Google’s share is stated as capacity, and neither the plant’s future availability nor the terms of the power uprate are public. The 1.9 TWh from 629 MW uses a 35% capacity factor, which is toward the upper end for onshore wind and reflects modern Finnish turbines on good northern sites; at 30% the figure would be 1.65 TWh and the combined total 5.8 rather than 6.0. Shares and per-person figures use Finnish electricity consumption of about 82 TWh and a population of 5.6 million. The 1 GW and the €520 million over twenty years are from a study Google commissioned, which is a fact about the study’s sponsor as much as about Finnish transmission, and the 1 GW is explicitly hypothetical rather than a statement of what Google will draw — the “about 80%” in the body is therefore a comparison of a real contract against a modelled load, and should be read as a sense of scale rather than a coverage ratio. The battery’s energy capacity was not published; the two-hour assumption behind 188 MWh is this edition’s and is the usual duration for a grid battery of that size, but a four-hour system would double it and change nothing about the conclusion. The 110 km2 uses chapter 4’s 2 W/m2 for onshore wind, which is a British figure applied to Finland for want of a Finnish one; Finnish land area per person is derived from 338 000 km2 and the same population.↩︎
Figure 11a.2 redraws a chart by Ilkka Hannula, “Finland’s data centre pipeline has outrun its scenarios” (Carbon Economics, 2026, CC BY 4.0), which is where this edition met the comparison. Four of its seven bars have since been read in their own sources and two have not; the seventh is the sum of the first three, so it is only as sound as the softest of them — which is the Helsingin Sanomat estimate below. The 285 MW is 33 data centres in September 2025, from Veli-Matti Mattila’s rapporteur report Datakeskusten kansallinen tiekartta (Valtioneuvoston julkaisuja 2025:94; the English translation, National Roadmap for Data Centres, is 2025:95), which takes it from a Ramboll census counting only facilities above 1 MW and excluding cryptocurrency mining. The 1300 MW decided or starting up, the €8 billion behind it and the 2500 MW and €21 billion at planning or feasibility stage are the Confederation of Finnish Industries’ green-transition investment dashboard at the end of August 2025, quoted in the same report — which adds both that unannounced projects would raise the figures and that not all plans will materialise. AFRY’s 2500 MW is the strong-development case of the price analysis in that report, against a 1200 MW baseline that assumes every project holding an investment decision is finished by 2030; the “more than 10%” on price and the finding on flexibility are AFRY’s, and the report itself calls the analysis indicative. The 1900 MW is this edition’s conversion, at the source chart’s 60%, of the KEITO scenarios’ assumption that data-centre electricity rises from about 1.3 TWh in 2024 — a figure KEITO takes from tax records — to about 10 TWh by 2050, in Koljonen, Soimakallio, Silfver and Kivinen (eds.), Kansallisen energia- ja ilmastopolitiikan uudet toimet ja skenaariot (KEITO), VTT Technology 442 (2025). The two taken at second hand are Luke’s 7000 MW for 2055 and Google’s 1300 MW: the first is read off the source chart, this edition not having seen the Luke publication; the second is Helsingin Sanomat’s estimate from the €13 billion rather than a disclosure, since Google publishes no capacity for the four sites, and every total here moves with it if it is wrong. Three cautions. The baseline may be low, and two independent counts say so. An independent census dated the same September verified 379.5 MW across 22 of 40 Finnish sites and put the likely total “on the order of 1 GW” on a wider definition; and figure 11a.1’s 2.7% of a Finnish peak somewhere between 14 and 15.5 GW implies 380 to 420 MW of IT capacity, which ought to be smaller than a connection figure rather than larger. Both point the same way, and a higher baseline raises the committed total rather than lowering it. The 52% utilisation is this edition’s, 1.3 TWh over 285 MW held for a year, and the two series need not cover the same set of facilities. And a decided project is firmer than a place in a connection queue but it is still not a building, so the cautions in this chapter’s queue sections apply here as well. The peak load of 15 553 MW on 8 January 2026 is Fingrid’s, a national record set at a consumption-weighted −19 °C and beating the 15 164 MW of January 2016. Finnish electricity consumption of 82 TWh and a population of 5.6 million are as in the Loviisa arithmetic above.↩︎
Figure 11a.2 redraws a chart by Ilkka Hannula, “Finland’s data centre pipeline has outrun its scenarios” (Carbon Economics, 2026, CC BY 4.0), which is where this edition met the comparison. Four of its seven bars have since been read in their own sources and two have not; the seventh is the sum of the first three, so it is only as sound as the softest of them — which is the Helsingin Sanomat estimate below. The 285 MW is 33 data centres in September 2025, from Veli-Matti Mattila’s rapporteur report Datakeskusten kansallinen tiekartta (Valtioneuvoston julkaisuja 2025:94; the English translation, National Roadmap for Data Centres, is 2025:95), which takes it from a Ramboll census counting only facilities above 1 MW and excluding cryptocurrency mining. The 1300 MW decided or starting up, the €8 billion behind it and the 2500 MW and €21 billion at planning or feasibility stage are the Confederation of Finnish Industries’ green-transition investment dashboard at the end of August 2025, quoted in the same report — which adds both that unannounced projects would raise the figures and that not all plans will materialise. AFRY’s 2500 MW is the strong-development case of the price analysis in that report, against a 1200 MW baseline that assumes every project holding an investment decision is finished by 2030; the “more than 10%” on price and the finding on flexibility are AFRY’s, and the report itself calls the analysis indicative. The 1900 MW is this edition’s conversion, at the source chart’s 60%, of the KEITO scenarios’ assumption that data-centre electricity rises from about 1.3 TWh in 2024 — a figure KEITO takes from tax records — to about 10 TWh by 2050, in Koljonen, Soimakallio, Silfver and Kivinen (eds.), Kansallisen energia- ja ilmastopolitiikan uudet toimet ja skenaariot (KEITO), VTT Technology 442 (2025). The two taken at second hand are Luke’s 7000 MW for 2055 and Google’s 1300 MW: the first is read off the source chart, this edition not having seen the Luke publication; the second is Helsingin Sanomat’s estimate from the €13 billion rather than a disclosure, since Google publishes no capacity for the four sites, and every total here moves with it if it is wrong. Three cautions. The baseline may be low, and two independent counts say so. An independent census dated the same September verified 379.5 MW across 22 of 40 Finnish sites and put the likely total “on the order of 1 GW” on a wider definition; and figure 11a.1’s 2.7% of a Finnish peak somewhere between 14 and 15.5 GW implies 380 to 420 MW of IT capacity, which ought to be smaller than a connection figure rather than larger. Both point the same way, and a higher baseline raises the committed total rather than lowering it. The 52% utilisation is this edition’s, 1.3 TWh over 285 MW held for a year, and the two series need not cover the same set of facilities. And a decided project is firmer than a place in a connection queue but it is still not a building, so the cautions in this chapter’s queue sections apply here as well. The peak load of 15 553 MW on 8 January 2026 is Fingrid’s, a national record set at a consumption-weighted −19 °C and beating the 15 164 MW of January 2016. Finnish electricity consumption of 82 TWh and a population of 5.6 million are as in the Loviisa arithmetic above.↩︎
Commission for Regulation of Utilities, Large Energy User connection policy decision paper, CRU2025236, published December 2025, https://www.cru.ie/about-us/news/the-cru-publishes-its-decision-on-new-electricity-connection-policy-for-data-centres/. The requirement described here is that a large energy user with a maximum import capacity of 1 MVA or more procure new and additional renewable electricity generated in the Republic of Ireland equal to at least 80% of its annual demand, reached on a “glide up” within six years of energisation, with related requirements on onsite or proximate dispatchable generation and storage, and with the system operators to publish a connection process by 31 March 2026. It supersedes the 2021 arrangements under which Dublin connections were refused or deferred. This edition has read the decision through law-firm summaries rather than the full paper, and the note says so; the summaries agree on the 80%, the 1 MVA threshold and the six years. Amazon’s Irish contracting — about 310 MW against a stated ambition near 800 MW, including the Derrinlough project with Bord na Móna — and Microsoft’s three onshore wind agreements with Energia, of about 25, 25 and 30 MW, are from Irish press and trade reporting; the individual sites are not listed here because the reporting disagrees about which counties they are in. The conversion to TWh is this edition’s, at a 30% capacity factor for Irish onshore wind, and the comparison is with the roughly 7 TWh of Irish data-centre electricity given at the head of this chapter. Two cautions. These are the publicly announced deals of two companies, not the whole of Irish data-centre procurement, so the 12% and 3% are floors on what has been contracted rather than measurements of what has. And the CRU policy binds new connections, so no inference about compliance follows from the gap.↩︎
Holtec International, EDF UK and Tritax, joint announcement on the Cottam site, Nottinghamshire, https://www.edfenergy.com/media-centre/holtec-international-edf-uk-and-tritax-announce-plans-develop-cottam-site-data-centres-and: a memorandum of understanding to develop a 1 GW data centre on the former coal station’s site, about 900 acres, powered principally by renewable generation until Holtec SMR-300 units enter service in the 2030s. A memorandum of understanding is not a project, and this one is at an earlier stage than Homer City, which has turbines ordered. The density comparison is this edition’s and is on the same basis as the Homer City figure earlier in this chapter: 900 acres is 3.64 km2, and 1 GW at the 85% load factor used throughout gives 850 MW average, or about 230 W/m2. Note that the two figures are not quite the same quantity — Homer City’s 290 W/m2 is generation averaged over its site, Cottam’s 230 is computing load averaged over its own — and they are comparable only because in both cases the generation and the computing are meant to sit on the same ground. The Rolls-Royce SMR programme, contracted with Great British Energy – Nuclear in April 2026 for three units at Wylfa, is a separate undertaking and is not tied to a data centre; it is mentioned only for its date. The pause of OpenAI’s Stargate UK project in April 2026, attributed in reporting to regulation and the cost of energy, is included because it is the counterweight: British electricity prices are the reason the same demand that is bidding for Finnish and Irish connections is not straightforwardly bidding for British ones.↩︎
BloombergNEF, Corporate Energy Market Outlook, reported February 2026: 55.9 GW of clean power contracted globally by corporations in 2025, 10% below the 2024 record and the first annual fall in nearly a decade, with EMEA down 13% to about 17 GW; Meta, Amazon, Google and Microsoft together 49% of global volume, Meta at 10.24 GW and Amazon at 10.22 GW, and Amazon the most active buyer in Europe and Asia-Pacific. The conversion to energy is this edition’s and is deliberately crude: 49% of 55.9 GW at a blended 30% capacity factor gives about 72 TWh a year, set against the IEA’s 415 TWh for world data centres in 2024 given at the head of this chapter. Three things that arithmetic does not capture. Announced capacity is not delivered capacity, and a contract signed in 2025 delivers over the following decade if the project is built at all. The comparison mixes a global procurement figure with a global consumption figure, but the procurement is heavily concentrated in the United States while the consumption is not, so the sixth is not a sixth of any particular grid. And these four companies buy clean power for everything they do, not only for data centres, though data centres are most of their load. The 24/7 argument in the body is the standard critique of annual matching and is Google’s own stated reason for its hourly carbon-free-energy target; nothing in this chapter’s sources measures how well any operator meets it.↩︎