15 Stuff

Figure 15.1. Selfridges’ rubbish advertisement.
One of the main sinks of energy in the “developed” world is the creation of stuff. In its natural life cycle, stuff passes through three stages. First, a new-born stuff is displayed in shiny packaging on a shelf in a shop. At this stage, stuff is called “goods.” As soon as the stuff is taken home and sheds its packaging, it undergoes a transformation from “goods” to its second form, “clutter.” The clutter lives with its owner for a period of months or years. During this period, the clutter is largely ignored by its owner, who is off at the shops buying more goods. Eventually, by a miracle of modern alchemy, the clutter is transformed into its final form, rubbish. To the untrained eye, it can be difficult to distinguish this “rubbish” from the highly desirable “good” that it used to be. Nonetheless, at this stage the discerning owner pays the dustman to transport the stuff away.
Let’s say we want to understand the full energy-cost of a stuff, perhaps with a view to designing better stuff. This is called life-cycle analysis. It’s conventional to chop the energy-cost of anything from a hair-dryer to a cruise-ship into four chunks:
| Material | Embodied energy (kWh per kg) |
|---|---|
| fossil fuel | 10 |
| wood | 5 |
| paper | 10 |
| glass | 7 |
| PET plastic | 30 |
| aluminium | 40 |
| steel | 6 |
Table 15.2. Embodied energy of materials.
- Phase R: Making raw materials. This phase involves digging minerals out of the ground, melting them, purifying them, and modifying them into manufacturers’ lego: plastics, glasses, metals, and ceramics, for example. The energy costs of this phase include the transportation costs of trundling the raw materials to their next destination.
- Phase P: Production. In this phase, the raw materials are processed into a manufactured product. The factory where the hair-dryer’s coils are wound, its graceful lines moulded, and its components carefully snapped together, uses heat and light. The energy costs of this phase include packaging and more transportation.
- Phase U: Use. Hair-dryers and cruise-ships both guzzle energy when they’re used as intended.
- Phase D: Disposal. This phase includes the energy cost of putting the stuff back in a hole in the ground (landfill), or of turning the stuff back into raw materials (recycling); and of cleaning up all the pollution associated with the stuff.
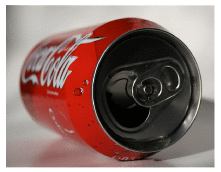
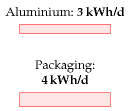
Figure 15.3. Five aluminium cans per day is 3 kWh/d. The embodied energy in other packaging chucked away by the average Brit is 4 kWh/d.
A note added in the 2026 revision. That 3 kWh/d assumes the can is thrown away, and table 15.2 shows why the assumption matters so much: at 40 kWh per kg, aluminium is the most energy-dense material in the table, four times paper or glass and nearly seven times steel. It is also the one where recycling saves most, because remelting scrap aluminium takes roughly a twentieth of the energy of winning the metal from bauxite.
Two countries have made that saving nearly complete, and the mechanism is a deposit rather than an appeal to virtue. Norway’s Infinitum scheme returns over 90% of all cans and bottles sold — 92.5% of cans in 2023, and 1.6 of the 1.7 billion containers sold in 2024. Sweden’s Returpack passed 3 billion containers deposited in 2025 for the first time, at an overall rate of 88.4% and 91% for cans specifically, which is past the national target.1
Put that through this chapter’s arithmetic. If 91% of cans come back and a recycled can costs about a twentieth of a new one to make, five cans a day costs roughly 0.4 kWh/d instead of 3 — a sevenfold reduction in one of the items on the consumption stack, achieved without anyone drinking less. It is the same lesson as the standby regulation in chapter 22: the saving came from changing the system the object moves through, not from persuading the person holding it.
Two honest qualifications. The 40 kWh/kg in table 15.2 is the figure for primary aluminium, so a can already made from recycled metal embodies far less to begin with and the saving is not additional to that. And the deposit covers cans and bottles, not the other 4 kWh/d of packaging in this figure, which has no deposit on it and comes back at nothing like 91%.
(Figure omitted from this edition: third-party rights.)
Figure 15.4. She’s making chips. Photo: ABB. Making one personal computer every two years costs 2.5 kWh per day.
To understand how much energy a stuff’s life requires, we should estimate the energy costs of all four phases and add them up. Usually one of these four phases dominates the total energy cost, so to get a reasonable estimate of the total energy cost we need accurate estimates only of the cost of that dominant phase. If we wish to redesign a stuff so as to reduce its total energy cost, we should usually focus on reducing the cost of the dominant phase, while making sure that energy-savings in that phase aren’t being undone by accompanying increases in the energy costs of the other three phases.
Rather than estimating in detail how much power the perpetual production and transport of all stuff requires, let’s first cover just a few common examples: drink containers, computers, batteries, junk mail, cars, and houses. This chapter focuses on the energy costs of phases R and P. These energy costs are sometimes called the “embodied” or “embedded” energy of the stuff – slightly confusing names, since usually that energy is neither literally embodied nor embedded in the stuff.
Drink containers
Let’s assume you have a coke habit: you drink five cans of multinational chemicals per day, and throw the aluminium cans away. For this stuff, it’s the raw material phase that dominates. The production of metals is energy intensive, especially for aluminium. Making one aluminium drinks-can needs 0.6 kWh. 2 So a five-a-day habit wastes energy at a rate of 3 kWh/d.
As for a 500 ml water bottle made of PET (which weighs 25 g), the embodied energy is 0.7 kWh 3 – just as bad as an aluminium can!
Other packaging
The average Brit throws away 400 g of packaging per day 4 – mainly food packaging. The embodied energy content of packaging ranges from 7 to 20 kWh per kg as we run through the spectrum from glass and paper to plastics and steel 5 cans. Taking the typical embodied energy content to be 10 kWh/kg, we deduce that the energy footprint of packaging is 4 kWh/d. A little of this embodied energy is recoverable by waste incineration, as we’ll discuss in Chapter 27.
Computers
Making a personal computer costs 1800 kWh of energy. 6 So if you buy a new computer every two years, that corresponds to a power consumption of 2.5 kWh per day.
Batteries
The energy cost of making a rechargeable nickel-cadmium AA battery, storing 0.001 kWh of electrical energy and having a mass of 25 g, is 1.4 kWh (phases R and P). 7 If the energy cost of disposable batteries is similar, throwing away two AA batteries per month uses about 0.1 kWh/d. The energy cost of batteries is thus likely to be a minor item in your stack of energy consumption.
Newspapers, magazines, and junk mail
A 36-page newspaper, distributed for free at railway stations, weighs 90 g. The Cambridge Weekly News (56 pages) weighs 150 g. The Independent (56 pages) weighs 200 g. A 56-page property-advertising glossy magazine and Cambridgeshire Pride Magazine (32 pages), both delivered free at home, weigh 100 g and 125 g respectively.

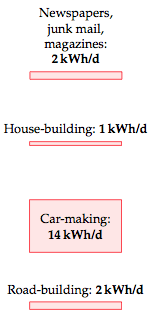
This river of reading material and advertising junk pouring through our letterboxes contains energy. It also costs energy to make and deliver. Paper has an embodied energy of 10 kWh per kg. 8 So the energy embodied in a typical personal flow of junk mail, magazines, and newspapers, amounting to 200 g of paper per day (that’s equivalent to one Independent per day for example) is about 2 kWh per day.
Paper recycling would save about half of the energy of manufacture; waste incineration or burning the paper in a home fire may make use of some of the contained energy.
Bigger stuff
The largest stuff most people buy is a house.
In Chapter H, I estimate the energy cost of making a new house. Assuming we replace each house every 100 years, the estimated energy cost is 2.3 kWh/d. This is the energy cost of creating the shell of the house only – the foundation, bricks, tiles, and roof beams. If the average house occupancy is 2.3, the average energy expenditure on house building is thus estimated to be 1 kWh per day per person.
What about a car, and a road? Some of us own the former, but we usually share the latter. A new car’s embodied energy is 76 000 kWh 9 – so if you get one every 15 years, that’s an average energy cost of 14 kWh per day. A life-cycle analysis by Treloar, Love, and Crawford estimates that building an Australian road costs 7600 kWh per metre (a continuously reinforced concrete road), and that, including maintenance costs, the total cost over 40 years was 35 000 kWh per metre. Let’s turn this into a ballpark figure for the energy cost of British roads. There are 28 000 miles of trunk roads and class-1 roads in Britain (excluding motorways). Assuming 35 000 kWh per metre per 40 years, those roads cost us 2 kWh/d per person.
The car, recalculated for an electric one
A section added in the 2026 revision. The 76 000 kWh above is the embodied energy of a car of MacKay’s era: a steel body, an engine, and no battery worth speaking of. An electric car is a different object to build, and since chapter 3 now shows a third of new cars in Britain and half in China being electric, the sum is worth redoing.
Almost all of the difference is the battery. Making cells is energy-intensive, and about half of a battery’s manufacturing emissions are simply the electricity consumed in the factory — which means the answer depends on where the plant is and what powers it, and has been falling as those plants move onto cleaner grids. Tesla’s own Impact Report puts the production emissions of a Model 3 at about 49% above a comparable combustion baseline.10
Carry that premium across to MacKay’s units and the arithmetic goes like this. If a combustion car embodies 76 000 kWh, an electric one of similar size embodies roughly 113 000 kWh, which over a 15-year life is about 21 kWh per day rather than 14. Making the car got substantially worse.
Now put that beside chapter 3, which is where the point lands:
| making it | driving it | total | |
|---|---|---|---|
| Petrol car, 33 mpg | 14 kWh/d | 40 kWh/d | 54 kWh/d |
| Electric car, 15 kWh/100 km | 21 kWh/d | 7.5 kWh/d | 28 kWh/d |
The electric car is worse to build by about 7 kWh a day and better to drive by about 32, so it wins on the total by roughly a factor of two. Chapter M sharpens that a little, and it is worth doing the arithmetic rather than asserting it.
The “driving it” column above counts the energy in the fuel, not the energy spent making the fuel available — which is exactly the omission chapter 3’s query raises. On the harmonised point-of-use figures, petrol has an EROI of about 4.2, so delivering 40 kWh/d of fuel to a tank costs roughly another 9.5 kWh/d of energy invested along the way. The electricity side barely moves: at a point-of-use EROI of 10 or so, delivering 7.5 kWh/d costs about 0.75 kWh/d, and even if the power came entirely from gas the figure would only reach 1.3.
| making it | driving it | fuel supply | total | |
|---|---|---|---|---|
| Petrol car, 33 mpg | 14 | 40 | 9.5 | 63.5 kWh/d |
| Electric car, 15 kWh/100 km | 21 | 7.5 | 0.8 | 29.3 kWh/d |
So the factor of two becomes about 2.2. That is a real widening and a modest one, and it is worth resisting the temptation to make more of it. What the correction changes is not the size of the answer but where the asymmetry comes from: the petrol car’s supply chain costs nearly a quarter as much again as the fuel it delivers, while the electric car’s costs a tenth of its much smaller draw.
Two caveats. MacKay’s own source put the well-to-tank ratio at 1.4 units of primary energy per unit of petrol, where the EROI route above gives about 1.24; the two use different bases — Treloar counts the crude itself as an input, the EROI figure does not — and they bracket the correction rather than agreeing on it. And the electricity figure assumes a grid whose sources sit near the harmonised values in chapter M, which is a statement about a national generating mix and not about any particular car. That margin is not delicate: it survives a considerably larger manufacturing penalty than the one assumed here, and it improves every year that battery factories run on cleaner electricity, because half the battery’s burden is the grid behind the plant.
Two warnings about this table. The first is a unit problem, and it is real: the 49% is a carbon dioxide premium, and I have applied it to an energy figure, which is only legitimate if the energy mixes behind the two are similar — they are not exactly, so treat 21 kWh/d as an order-of-magnitude figure rather than a measurement. The second is that the whole comparison is per-year, so it depends on how long cars last. If an electric car lasts twenty years instead of fifteen, its manufacturing column falls to 16 kWh/d; if the battery forces early retirement at ten, it rises to 31 and the advantage narrows sharply. Longevity does more work in this table than any of the engineering.
The wider point is the one this chapter exists to make. Chapter 3 counts only the fuel, and on fuel alone the electric car looks five times better. Counting the stuff as well as the driving, it is about twice as good. Both numbers are true; the second is the honest one, and it is smaller.
Who makes the battery
There is a second question hiding in that table, and it is the one this chapter raises about gizmos generally: not how much energy the battery embodies, but where it is embodied. MacKay notes below that Britain’s imported goods do not appear in its energy accounts, and that a country which used to make its own things now buys them. The battery is that argument’s largest single instance.
The costs are not close. BloombergNEF’s 2025 survey puts the global average lithium-ion pack price at $108/kWh (£85), but the average conceals the thing that matters: China at $84/kWh (£66), Europe 56% higher, North America 44% higher.11 And the gap is widening rather than closing. In the same year, Chinese pack prices fell 13%, European prices 8%, and North American prices 4%. A cost difference that grows while everyone is trying to close it is a structural difference, not a temporary one.
Manufacturing is concentrated to match. Six Chinese firms supplied about 69% of all electric-vehicle batteries installed worldwide in the first ten months of 2025, CATL alone accounting for roughly a third of global cell sales. Estimates of China’s share of total cell capacity run from 75% to 85% depending on what is counted.
The European response has been tariffs. Definitive countervailing duties on Chinese battery-electric cars took effect on 30 October 2024 at rates from 17.0% to 35.3%, on top of the standard 10% car duty — 17.4% for BYD, 19.9% for Geely, 35.3% for SAIC and for anyone who did not cooperate with the investigation, and 9.0% for Tesla exporting from Shanghai.12 Set the arithmetic side by side: the duty is of the same order as the cost gap it is answering. It offsets the advantage without reversing it, and it is a fixed number set against a gap that moved 5 percentage points in China’s favour in a single year.
None of that is an energy calculation, and this book is careful to distinguish what physics settles from what politics does. The physics is settled and unglamorous: a battery embodies roughly what the table above says, wherever it is made. What is not settled is whether the country doing the driving is also the country doing the making — and on present numbers, for most of the world, it is not.
Rocks are not the bottleneck
It is natural to answer all this by looking for the raw materials, and Europe has been doing so. Two cautions are needed before that answer works, and the first is a matter of definition.
Rare earths are not battery materials. The seventeen rare-earth elements go into permanent magnets — the motors that turn the wheels, and the generators inside wind turbines — not into lithium-ion cells. A battery needs lithium, cobalt, nickel, manganese and graphite, which is a different list with a different geography. So when LKAB announced that its Per Geijer deposit at Kiruna is Europe’s largest known rare-earth find, and in 2023 revised it upward by 25% to over 1.3 million tonnes of rare-earth oxides, alongside 734 million tonnes of iron ore and a phosphorus grade of 2.3%, the thing being solved was the magnet, not the cell.13 That is worth having. It is not the battery problem.
The second caution is the more important one, and it applies to both lists. The chokepoint is refining, not mining. On the IEA’s 2025 assessment China holds over 90% of world refining capacity for graphite and for rare earths, and about 60% for lithium and for cobalt. For 19 of the 20 strategic minerals surveyed, China is the leading refiner, with an average share of 70%. Concentration is rising rather than falling: the combined share of the top three refining countries went from about 82% in 2020 to 86% in 2024, with almost all the growth in Chinese capacity.14
That is why a deposit does not settle the question. André Månberger of Lund makes the point precisely: Swedish ore would be exported unprocessed, while China’s position rests on keeping the value chain and exporting the finished magnet, generator or battery. “Rare” describes concentration rather than scarcity, so extraction is marginal by nature and depends on prices that Chinese refining capacity substantially sets. The Swedish state, he notes, would collect very little either way — the returns accrue to the mining company, with modest mineral and corporate taxes behind them. His group also finds that LKAB’s existing mining waste alone could hold rare earths equivalent to about 30% of the EU’s current import needs, which suggests the tailings may matter as much as the new mine.15
Then there is the timescale, which is the sort of thing this book exists to point out. LKAB applied for its extraction concession in June 2023 and says that Swedish permitting takes 10 to 15 years, against an EU expectation of two-year approvals. A mine opening in the late 2030s is a contribution to the 2040s. It does not change what a European battery costs in 2030, and it is not a reply to a pack-price gap that widened by five percentage points last year.
So the honest summary is a stack of three separate problems that are often discussed as one. Europe has some of the rock. It has very little of the refining. And it has less of the cell manufacturing than either. Fixing the first does not touch the other two, and the other two are where the cost difference in the previous section actually comes from.
Transporting the stuff
Up till now I’ve tried to make estimates of personal consumption. “If you chuck away five coke-cans, that’s 3 kWh; if you buy The Independent, that’s 2 kWh.” From here on, however, things are going to get a bit less personal. As we estimate the energy required to transport stuff around the country and around the planet, I’m going to look at national totals and divide them by the population.
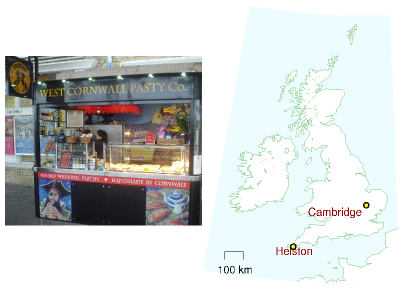
Figure 15.5. Food-miles – Pasties, hand-made in Helston, Cornwall, shipped 580 km for consumption in Cambridge.
Freight transport is measured in ton-kilometres (t-km). If one ton of Cornish pasties are transported 580 km (figure 15.5) then we say 580 t-km of freight transport have been achieved. The energy intensity of road transport in the UK is about 1 kWh per t-km. 16
(Figure omitted from this edition: third-party rights.)
Figure 15.6. The container ship Ever Uberty at Thamesport Container Terminal. Photo by Ian Boyle www.simplonpc.co.uk. 17
When the container ship in figure 15.6 transports 50 000 tons of cargo a distance of 10 000 km, it achieves 500 million t-km of freight transport. The energy intensity of freight transport by this container ship is 0.015 kWh per t-km. Notice how much more efficient transport by container-ship is than transport by road. These energy intensities are displayed in figure 15.8.
Transport of stuff by road
In 2006, the total amount of road transport in Britain by heavy goods vehicles was 156 billion t-km. Shared between 60 million, that comes to 7 t-km per day per person, which costs 7 kWh per day per person (assuming an energy intensity of 1 kWh per ton-km). One quarter of this transport, by the way, was of food, drink, and tobacco.

Figure 15.7. The lorry delivereth and the lorry taketh away. Energy cost of UK road freight: 7 kWh/d per person.
Transport by water
In 2002, 560 million tons of freight passed through British ports. The Tyndall Centre calculated that Britain’s share of the energy cost of international shipping is 4 kWh/d per person. 18

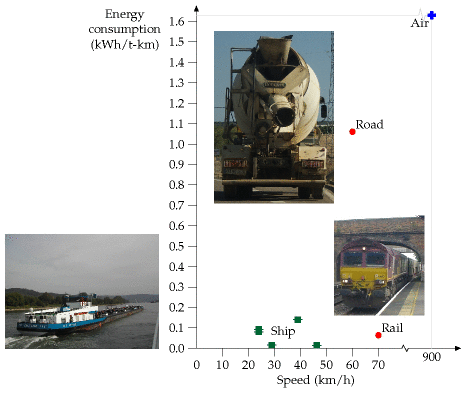
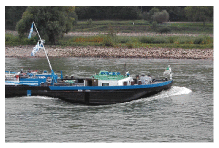
Figure 15.8. Energy requirements of different forms of freight-transport. The vertical coordinate shows the energy consumed in kWh per net ton-km, (that is, the energy per t-km of freight moved, not including the weight of the vehicle). See also figure 20.23 (energy requirements of passenger transport). Water transport requires energy because boats make waves. Nevertheless, transporting freight by ship is surprisingly energy efficient. 19
Transport of water; taking the pee
Water’s not a very glamorous stuff, but we use a lot of it – about 160 litres per day per person. In turn, we provide about 160 litres per day per person of sewage to the water companies. The cost of pumping water around the country and treating our sewage is about 0.4 kWh per day per person. 20
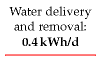
Figure 15.9. Water delivery: 0.3 kWh/d; sewage processing: 0.1 kWh/d.
Desalination
At the moment the UK doesn’t spend energy on water desalination. But there’s talk of creating desalination plants in London. What’s the energy cost of turning salt water into drinking water? The least energy-intensive method is reverse osmosis. Take a membrane that lets through only water, put salt water on one side of it, and pressurize the salt water. Water reluctantly oozes through the membrane, producing purer water – reluctantly, because pure water separated from salt has low entropy, and nature prefers high entropy states where everything is mixed up. We must pay high-grade energy to achieve unmixing.
The Island of Jersey has a desalination plant that can produce 6000 m3 of pure water per day (figure 15.10). Including the pumps for bringing the water up from the sea and through a series of filters, the whole plant uses a power of 2 MW. That’s an energy cost of 8 kWh per m3 of water produced. At a cost of 8 kWh per m3, a daily water consumption of 160 litres would require 1.3 kWh per day.
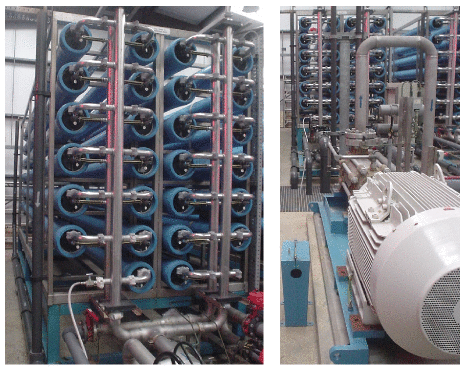
Figure 15.10. Part of the reverse-osmosis facility at Jersey Water’s desalination plant. The pump in the foreground, right, has a power of 355 kW and shoves seawater at a pressure of 65 bar into 39 spiral-wound membranes in the banks of blue horizontal tubes, left, delivering 1500 m3 per day of clean water. The clean water from this facility has a total energy cost of 8 kWh per m3.
Stuff retail
Supermarkets in the UK consume about 11 TWh of energy per year. 21 Shared out equally between 60 million happy shoppers, that’s a power of 0.5 kWh per day per person.

The significance of imported stuff
In standard accounts of “Britain’s energy consumption” or “Britain’s carbon footprint,” imported goods are not counted. Britain used to make its own gizmos, and our per-capita footprint in 1910 was as big as America’s is today. Now Britain doesn’t manufacture so much (so our energy consumption and carbon emissions have dropped a bit), but we still love gizmos, and we get them made for us by other countries. Should we ignore the energy cost of making the gizmo, because it’s imported? I don’t think so. Dieter Helm and his colleagues in Oxford estimate that under a correct account, allowing for imports and exports, Britain’s carbon footprint is nearly doubled from the official “11 tons CO2e per person” to about 21 tons. This implies that the biggest item in the average British person’s energy footprint is the energy cost of making imported stuff. 22
In Chapter H, I explore this idea further, by looking at the weight of Britain’s imports. Leaving aside our imports of fuels, we import a little over 2 tons per person of stuff every year, of which about 1.3 tons per person are processed and manufactured stuff like vehicles, machinery, white goods, and electrical and electronic equipment. That’s about 4 kg per day per person of processed stuff. Such goods are mainly made of materials whose production required at least 10 kWh of energy per kg of stuff. I thus estimate that this pile of cars, fridges, microwaves, computers, photocopiers and televisions has an embodied energy of at least 40 kWh per day per person.
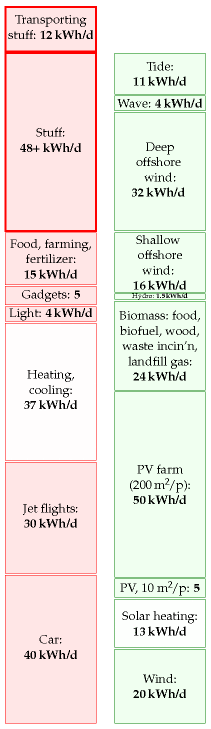
Figure 15.11. Making our stuff costs at least 48 kWh/d. Delivering the stuff costs 12 kWh/d.
To summarize all these forms of stuff and stuff-transport, I will put on the consumption stack 48 kWh per day per person for the making of stuff (made up of at least 40 for imports, 2 for a daily newspaper, 2 for roadmaking, 1 for house-making, and 3 for packaging); and another 12 kWh per day per person for the transport of the stuff by sea, by road, and by pipe, and the storing of food in supermarkets.
Work till you shop.
Traditional saying
The imported half, revisited
A section added in the 2026 revision. This chapter’s largest claim is that “the biggest item in the average British person’s energy footprint is the energy cost of making imported stuff”, resting on Dieter Helm’s estimate that Britain’s true footprint was about 21 tonnes of CO2e per person against an official territorial figure of 11.
Both halves of that can now be checked, and they moved in opposite directions.
The footprint halved
Britain’s consumption-based emissions — the official carbon footprint, which counts imports — were 10 tonnes of CO2e per person in 2023, down 5% on the previous year and down 37% from a peak of 16 tonnes in 2004. Against the roughly 21 tonnes Helm estimated when this chapter was written, that is a fall of more than half.23
The distinction that matters here
There is a trap in that improvement, and this book is unusually well placed to name it.
A carbon footprint is not an energy footprint. A large part of the fall is that the electricity making the stuff got cleaner rather than that less stuff got made. Britain removed coal from its grid entirely, as chapter 28a records; China added more solar capacity than the world had in total when this book was written, as chapter 6 does. Decarbonising the electricity that builds a fridge reduces the carbon dioxide attached to the fridge without reducing the kilowatt-hours.
This chapter’s 48 kWh/d per person is denominated in energy. The statistic that halved is denominated in carbon. They are not the same improvement, and there is no reason to assume the energy figure has fallen by anything like 37%.
That is the same lesson as chapter M’s, arriving in a different chapter: what you measure decides what you conclude, and two accounts of the same activity can move in opposite directions without either being wrong. MacKay chose energy deliberately, because it is the harder quantity to move and the one the laws of physics constrain. Eighteen years later that choice looks better, not worse — the carbon number has improved considerably faster than the underlying activity, and only one of the two is a measure of how much stuff we make.
The third mechanism: the making left
There is a way of reducing a country’s territorial emissions that involves neither efficiency nor restraint, and Britain has been doing it.
In steel, British production is now the smallest it has been since the 1930s, following the closure of the blast furnaces at Port Talbot in 2024. Primary steelmaking in Britain has largely ended.
In chemicals, the industry body records 25 site closures in five years, and its own survey of members reports weak demand, falling employment and the likelihood of more.
In refining, two of Britain’s six refineries — Grangemouth and Lindsey — have closed since 2019, with about 820 direct jobs; Grangemouth’s closure took the neighbouring Mossmorran ethylene plant with it and another 180.24
None of that reduces demand for steel, chemicals or fuel. It relocates the making of them, and with it the energy and the emissions, which then return as imports and appear in the account described above rather than in the territorial one.
This is the third mechanism behind the halving. The first is genuine efficiency. The second is cleaner electricity making the same goods. The third is not making the goods. Only the first two are improvements, and the accounts as usually published cannot tell them apart.
Chapter 28a supplies the reason, and it is the same number that chapter runs on: of 28 IEA countries reporting industrial electricity prices for 2024, the United Kingdom’s were the highest, at about 25.3p per kWh against an EU-14 median of 11.3p. A smelter, a refinery or a chemical works is a machine for turning electricity and gas into product, and Britain is the most expensive place in the developed world to run one. Germany’s experience, recorded in the same chapter — energy-intensive output settling at about 82% of its 2021 level after its gas price rose — is the same mechanism at a slower speed.
So the answer to whether heavy industry left Britain for cheaper countries is yes, and this chapter’s arithmetic is where it shows up: as a falling territorial number, a rising imported share, and an energy total that did not move nearly as much as either.
Notes and further reading
- Dry cargo vessel 0.08 kWh/t-km. A vessel with a grain capacity of 5200 m3 carries 3360 deadweight tons. (Deadweight tonnage is the mass of cargo that the ship can carry.) It travels at speed 13 kn (24 km/h); its one engine with 2 MW delivered power consumes 186 g of fuel-oil per kWh of delivered energy (42% efficiency). conoship.com/uk/vessels/detailed/page7.htm
- Oil tanker A modern oil tanker uses 0.017 kWh/t-km [6lbrab]. Cargo weight 40 000 t. Capacity: 47 000 m3. Main engine: 11.2 MW maximum delivered power. Speed at 8.2 MW: 15.5 kn (29 km/h). The energy contained in the oil cargo is 520 million kWh. So 1% of the energy in the oil is used in transporting the oil one-quarter of the way round the earth (10 000 km).
- Roll-on, roll-off carriers The ships of Wilh. Wilhelmsen shipping company deliver freight-transport with an energy cost between 0.028 and 0.05 kWh/t-km [5ctx4k].

Norway: Infinitum’s deposit-return scheme, return rates above 90% sustained, 92.5% for cans in 2023 and 1.6 billion of 1.7 billion containers collected in 2024. Sweden: Returpack/Pantamera reported over 3 billion cans and bottles deposited in 2025, an overall rate of 88.4% against a national target of 90%, and 91% for cans alone. The ratio of recycled to primary aluminium energy is conventionally put at about 1:20.↩︎
One aluminium drinks can costs 0.6 kWh. The mass of one can is 15 g. Estimates of the total energy cost of aluminium manufacture vary from 60 MJ/kg to 300 MJ/kg. [yx7zm4], [r22oz], [yhrest]. The figure I used is from The Aluminum Association [y5as53]: 150 MJ per kg of aluminium (40 kWh/kg).↩︎
The embodied energy of a water bottle made of PET. Source: Hammond and Jones (2006) – PET’s embodied energy is 30 kWh per kg.↩︎
The average Brit throws away 400 g of packaging per day. In 1995, Britain used 137 kg of packaging per person (Hird et al., 1999).↩︎
…steel… From Swedish Steel, “The consumption of coal and coke is 700 kg per ton of finished steel, equal to approximately 5320 kWh per ton of finished steel. The consumption of oil, LPG and electrical power is 710 kWh per ton finished product. Total [primary] energy consumption is thus approx. 6000 kWh per ton finished steel.” (6 kWh per kg.) [y2ktgg]↩︎
A personal computer costs 1800 kWh of energy. Manufacture of a PC requires (in energy and raw materials) the equivalent of about 11 times its own weight of fossil fuels. Fridges require 1–2 times their weight. Cars require 1–2 times their weight. Williams (2004); Kuehr (2003).↩︎
…a rechargeable nickel-cadmium battery. Source: Rydh and Karlström(2002).↩︎
Paper has an embodied energy of 10 kWh per kg. Making newspaper from virgin wood has an energy cost of about 5 kWh/kg, and the paper itself has an energy content similar to that of wood, about 5 kWh/kg. (Source: Ucuncu (1993); Erdincler and Vesilind (1993); see p284.) Energy costs vary between mills and between countries. 5 kWh/kg is the figure for a Swedish newspaper mill in 1973 from Norrström (1980), who estimated that efficiency measures could reduce the cost to about 3.2 kWh/kg. A more recent full life-cycle analysis (Denison, 1997) estimates the net energy cost of production of newsprint in the USA from virgin wood followed by a typical mix of landfilling and incineration to be 12 kWh/kg; the energy cost of producing newsprint from recycled material and recycling it is 6 kWh/kg.↩︎
A new car’s embodied energy is 76 000 kWh. Source: Treloar et al. (2004). Burnham et al. (2007) give a lower figure: 30 500 kWh for the net life-cycle energy cost of a car. One reason for the difference may be that the latter lifecycle analysis assumes the vehicle is recycled, thus reducing the net materials cost.↩︎
Tesla’s Impact Report gives Model 3 production emissions about 49% above a comparable internal-combustion baseline, and notes that around half of a battery’s lifecycle emissions come from the electricity used to manufacture and assemble it. Independent estimates of cell manufacturing have improved over time, with one widely cited 2019 revision putting battery production near 85 kg CO2 per kWh of capacity, roughly half earlier estimates. The conversion of a carbon premium into an energy premium in the table above is mine and is approximate; see the warning in the text.↩︎
BloombergNEF’s annual battery price survey, December 2025: global volume-weighted average pack price of $108/kWh, down 8% on 2024; China lowest at $84/kWh, with European packs 56% and North American packs 44% above that; annual declines of 13%, 8% and 4% respectively. Note that these are volume-weighted averages dominated by passenger vehicles. Packs for commercial vehicles, made in far smaller numbers, are dearer than these averages in Europe, and the European premium quoted for a truck pack can be nearer a factor of two than the 1.56 implied here.↩︎
Definitive EU countervailing duties on Chinese battery-electric vehicles, in force 30 October 2024, additional to the standard 10% duty. The widely quoted “up to 38%” figure was the provisional rate announced in July 2024; the definitive top rate is 35.3%.↩︎
LKAB, “Europas största fyndighet av sällsynta jordartsmetaller nu 25 procent större”, on the Per Geijer deposit at Kiruna: mineral resources of over 1.3 million tonnes of total rare-earth oxides after a 25% upward revision, 734 million tonnes of iron ore (307 Mt indicated, 421 Mt inferred), and an average phosphorus grade of 2.3%. The extraction concession was applied for on 12 June 2023; LKAB’s own estimate of the Swedish permitting timeline is 10 to 15 years.↩︎
IEA, Global Critical Minerals Outlook 2025. Chinese refining shares of over 90% for graphite and rare earths and about 60% for lithium and cobalt; leading refiner for 19 of 20 strategic minerals at an average 70% share; top-three refiner concentration rising from about 82% in 2020 to 86% in 2024.↩︎
André Månberger, environment and energy systems, LTH, Lund University, quoted in “Sällsynta metaller blir ingen kassako för Sverige — men viktiga för EU”: https://www.lu.se/artikel/sallsynta-metaller-blir-ingen-kassako-sverige-men-viktiga-eu. The 30% figure refers to rare earths recoverable from existing LKAB mining waste, not to the Per Geijer deposit.↩︎
The energy intensity of road transport in the UK is about 1 kWh per t-km. Source: www.dft.gov.uk/pgr/statistics/datatablespublications/energyenvironment.↩︎
The energy intensity of freight transport by this container ship is 0.015 kWh per ton-km. The Ever Uberty – length 285 m, breadth 40 m – has a capacity of 4948 TEUs, deadweight 63 000 t, and a service speed of 25 knots; its engine’s normal delivered power is 44 MW. One TEU is the size of a small 20-foot container – about 40 m3. Most containers you see today are 40-foot containers with a size of 2 TEU. A 40-foot container weighs 4 tons and can carry 26 tons of stuff. Assuming its engine is 50%-efficient, this ship’s energy consumption works out to 0.015 kWh of chemical energy per ton-km. www.mhi.co.jp/en/products/detail/container_ship_ever_uberty.html↩︎
Britain’s share of international shipping… Source: Anderson et al. (2006).↩︎
Figure 15.8. Energy consumptions of ships. The five points in the figure are a container ship (46 km/h), a dry cargo vessel (24 km/h), an oil tanker (29 km/h), an inland marine ship (24 km/h), and the NS Savannah (39 km/h).↩︎
Water delivery and sewage treatment costs 0.4 kWh/d per person. The total energy use of the water industry in 2005–6 was 7703 GWh. Supplying 1 m3 of water has an energy cost of 0.59 kWh. Treating 1 m3 of sewage has an energy cost of 0.63 kWh. For anyone interested in greenhouse-gas emissions, water supply has a footprint of 289 g CO2 per m3 of water delivered, and wastewater treatment, 406 g CO2 per m3 of wastewater. Domestic water consumption is 151 litres per day per person. Total water consumption is 221 l/d per person. Leakage amounts to 57 litres per day per person. Sources: Parliamentary Office of Science and Technology [www.parliament.uk/documents/upload/postpn282.pdf], Water UK (2006).↩︎
Helm et al. suggest that, allowing for imports and exports, Britain’s carbon footprint is nearly doubled to about 21 tons. Helm et al. (2007).↩︎
Consumption-based emissions from the Department for Environment, Food and Rural Affairs, Carbon footprint for the UK and England to 2023: 10 tonnes CO2e per person in 2023, down 5% on 2022 and 37% below the 2004 peak of 16 tonnes. Import share figures are from the Office for National Statistics’ greenhouse gas emissions and trade accounts and associated analysis: the imported portion of the UK consumption-based account rising from 34% in 1990 to about 61% in 2022, with imported emissions rising from 138 Mt CO2e in 1996 to 182 Mt in 2021. A separate published figure of about 53% “made abroad” for 2023 reflects a different boundary; the two are not in conflict but are not interchangeable either, and the text quotes the range. Two cautions. Consumption-based accounts require modelling trade flows through multi-region input–output tables and carry materially wider uncertainty than territorial inventories, which is why they are published later and revised more. And Helm’s roughly 21-tonne estimate was an independent academic figure on a different vintage of method from today’s official series, so the halving quoted here compares two things that are close but not identical.↩︎
British steel output at its lowest since the 1930s following the 2024 closure of the Port Talbot blast furnaces; 25 chemical site closures over five years and the sector’s own survey reporting further expected closures, from the Chemical Industries Association; and the closure since 2019 of two of the United Kingdom’s six refineries, Grangemouth and Lindsey, with about 820 direct jobs, followed by the Mossmorran ethylene plant with a further 180. Attribution needs care here. Energy prices are one cause among several — global overcapacity in steel, the age of the plant, carbon pricing, corporate strategy and the general shift of heavy manufacturing to Asia all contribute, and the industry bodies quoted have an interest in emphasising energy costs. What is not in dispute is the direction: the capacity closed, the demand did not, and the difference is imported. Some of the closures are also substitutions rather than losses — Port Talbot is being replaced with an electric arc furnace, which makes steel from scrap at far lower energy intensity but cannot make primary steel at all.↩︎