25 Living on other countries’ renewables?
Whether the Mediterranean becomes an area of cooperation or confrontation in the 21st century will be of strategic importance to our common security.
Joschka Fischer, German Foreign Minister, February 2004
We’ve found that it’s hard to get off fossil fuels by living on our own renewables. Nuclear has its problems too. So what else can we do? Well, how about living on someone else’s renewables? (Not that we have any entitlement to someone else’s renewables, of course, but perhaps they might be interested in selling them to us.)
| Technology | Power per unit land or water area |
|---|---|
| Wind | 2 W/m2 |
| Offshore wind | 3 W/m2 |
| Tidal pools | 3 W/m2 |
| Tidal stream | 6 W/m2 |
| Solar PV panels | 5–20 W/m2 |
| Plants | 0.5 W/m2 |
| Rain-water (highlands) | 0.24 W/m2 |
| Hydroelectric facility | 11 W/m2 |
| Solar chimney | 0.1 W/m2 |
| Concentrating solar power (desert) | 15 W/m2 |
Table 25.1. Renewable facilities have to be country-sized because all renewables are so diffuse.
Most of the resources for living sustainably are related to land area: if you want to use solar panels, you need land to put them on; if you want to grow crops, you need land again. Jared Diamond, in his book Collapse, observes that, while many factors contribute to the collapse of civilizations, a common feature of all collapses is that the human population density became too great.
Places like Britain and Europe are in a pickle because they have large population densities, and all the available renewables are diffuse – they have small power density (table 25.1). When looking for help, we should look to countries that have three things: a) low population density; b) large area; and c) a renewable power supply with high power density.
| Region | Population | Area (km2) |
Density (persons per km2) |
Area per person (m2) |
|---|---|---|---|---|
| Libya | 5 760 000 | 1 750 000 | 3 | 305 000 |
| Kazakhstan | 15 100 000 | 2 710 000 | 6 | 178 000 |
| Saudi Arabia | 26 400 000 | 1 960 000 | 13 | 74 200 |
| Algeria | 32 500 000 | 2 380 000 | 14 | 73 200 |
| Sudan | 40 100 000 | 2 500 000 | 16 | 62 300 |
| World | 6 440 000 000 | 148 000 000 | 43 | 23 100 |
| Scotland | 5 050 000 | 78 700 | 64 | 15 500 |
| European Union | 496 000 000 | 4 330 000 | 115 | 8 720 |
| Wales | 2 910 000 | 20 700 | 140 | 7 110 |
| United Kingdom | 59 500 000 | 244 000 | 243 | 4 110 |
| England | 49 600 000 | 130 000 | 380 | 2 630 |
Table 25.2. Some regions, ordered from small to large population density. See chapter J for more population densities.
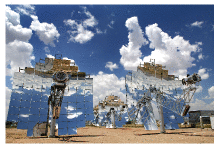
Figure 25.3. Stirling dish engine. These beautiful concentrators deliver a power per unit land area of 14 W/m2. Photo courtesy of Stirling Energy Systems. www.stirlingenergy.com
(Figure omitted from this edition: third-party rights.)
Figure 25.4. Andasol – a “100MW” solar power station under construction in Spain. Excess thermal energy produced during the day will be stored in liquid salt tanks for up to seven hours, allowing a continuous and stable supply of electric power to the grid. The power station is predicted to produce 350 GWh per year (40 MW). The parabolic troughs occupy 400 hectares, so the power per unit land area will be 10 W/m2. Upper photo: ABB. Lower photo: IEA SolarPACES.
Table 25.2 highlights some countries that fit the bill. Libya’s population density, for example, is 70 times smaller than Britain’s, and its area is 7 times bigger. Other large, area-rich, countries are Kazakhstan, Saudi Arabia, Algeria, and Sudan.
In all these countries, I think the most promising renewable is solar power, concentrating solar power in particular, which uses mirrors or lenses to focus sunlight. Concentrating solar power stations come in several flavours, arranging their moving mirrors in various geometries, and putting various power conversion technologies at the focus – Stirling engines, pressurized water, or molten salt, for example – but they all deliver fairly similar average powers per unit area, in the ballpark of 15 W/m2.
A technology that adds up
“All the world’s power could be provided by a square 100 km by 100 km in the Sahara.” Is this true? Concentrating solar power in deserts delivers an average power per unit land area of roughly 15 W/m2. 1 So, allowing no space for anything else in such a square, the power delivered would be 150 GW. This is not the same as current world power consumption. It’s not even near current world electricity consumption, which is 2000 GW. World power consumption today is 15 000 GW. So the correct statement about power from the Sahara is that today’s consumption could be provided by a 1000 km by 1000 km square in the desert, completely filled with concentrating solar power. That’s four times the area of the UK. And if we are interested in living in an equitable world, we should presumably aim to supply more than today’s consumption. To supply every person in the world with an average European’s power consumption (125 kWh/d), the area required would be two 1000 km by 1000 km squares in the desert.
Fortunately, the Sahara is not the only desert, so maybe it’s more relevant to chop the world into smaller regions, and ask what area is needed in each region’s local desert. So, focusing on Europe, “what area is required in the North Sahara to supply everyone in Europe and North Africa with an average European’s power consumption? Taking the population of Europe and North Africa to be 1 billion, the area required drops to 340 000 km2, which corresponds to a square 600 km by 600 km. This area is equal to one Germany, to 1.4 United Kingdoms, or to 16 Waleses.
The UK’s share of this 16-Wales area would be one Wales: a 145 km by 145 km square in the Sahara would provide all the UK’s current primary energy consumption. These squares are shown in figure 25.5. Notice that while the yellow square may look “little” compared with Africa, it does have the same area as Germany.
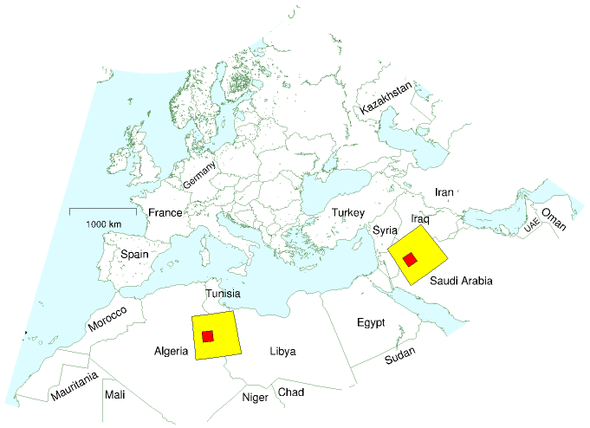
Figure 25.5. The celebrated little square. This map shows a square of size 600 km by 600 km in Africa, and another in Saudi Arabia, Jordan, and Iraq. Concentrating solar power facilities completely filling one such square would provide enough power to give 1 billion people the average European’s consumption of 125 kWh/d. The area of one square is the same as the area of Germany, and 16 times the area of Wales. Within each big square is a smaller 145 km by 145 km square showing the area required in the Sahara – one Wales – to supply all British power consumption.
The DESERTEC plan
An organization called DESERTEC [www.desertec.org] is promoting a plan to use concentrating solar power in sunny Mediterranean countries, and high-voltage direct-current (HVDC) transmission lines (figure 25.7) to deliver the power to cloudier northern parts. HVDC technology has been in use since 1954 to transmit power both through overhead lines and through submarine cables (such as the interconnector between France and England). It is already used to transmit electricity over 1000-km distances in South Africa, China, America, Canada, Brazil, and Congo. 2 A typical 500 kV line can transmit a power of 2 GW. A pair of HVDC lines in Brazil transmits 6.3 GW.
HVDC is preferred over traditional high-voltage AC lines because less physical hardware is needed, less land area is needed, and the power losses of HVDC are smaller. The power losses on a 3500 km-long HVDC line, including conversion from AC to DC and back, would be about 15%. 3 A further advantage of HVDC systems is that they help stabilize the electricity networks to which they are connected.
In the DESERTEC plans, the prime areas to exploit are coastal areas, because concentrating solar power stations that are near to the sea can deliver desalinated water as a by-product – valuable for human use, and for agriculture.
Table 25.6 shows DESERTEC’s estimates of the potential power that could be produced in countries in Europe and North Africa. The “economic potential” adds up to more than enough to supply 125 kWh per day to 1 billion people. The total “coastal potential” is enough to supply 16 kWh per day per person to 1 billion people.
| Country |
Economic potential (TWh/y) |
Coastal potential (TWh/y) |
|---|---|---|
| Algeria | 169 000 | 60 |
| Libya | 140 000 | 500 |
| Saudi Arabia | 125 000 | 2 000 |
| Egypt | 74 000 | 500 |
| Iraq | 29 000 | 60 |
| Morocco | 20 000 | 300 |
| Oman | 19 000 | 500 |
| Syria | 10 000 | 0 |
| Tunisia | 9 200 | 350 |
| Jordan | 6 400 | 0 |
| Yemen | 5 100 | 390 |
| Israel | 3 100 | 1 |
| UAE | 2 000 | 540 |
| Kuwait | 1 500 | 130 |
| Spain | 1 300 | 70 |
| Qatar | 800 | 320 |
| Portugal | 140 | 7 |
| Turkey | 130 | 12 |
| Total |
620 000 (70 000 GW) |
6 000 (650 GW) |
Table 25.6. Solar power potential in countries around and near to Europe. The “economic potential” is the power that could be generated in suitable places where the direct normal irradiance is more than 2000 kWh/m2/y. The “coastal potential” is the power that could be generated within 20 m (vertical) of sea level; such power is especially promising because of the potential combination with desalination. For comparison, the total power required to give 125 kWh per day to 1 billion people is 46 000 TWh/y (5 200 GW). 6000 TWh/y (650 GW) is 16 kWh per day per person for 1 billion people.
(Figure omitted from this edition: third-party rights.)
Figure 25.7. Laying a high-voltage DC link between Finland and Estonia. A pair of these cables transmit a power of 350 MW. Photo: ABB.
Let’s try to convey on a map what a realistic plan could look like. Imagine making solar facilities each having an area of 1500 km2 – that’s roughly the size of London. (Greater London has an area of 1580 km2; the M25 orbital motorway around London encloses an area of 2300 km2.) Let’s call each facility a blob. Imagine that in each of these blobs, half the area is devoted to concentrating power stations with an average power density of 15 W/m2, leaving space around for agriculture, buildings, railways, roads, pipelines, and cables. Allowing for 10% transmission loss between the blob and the consumer, each of these blobs generates an average power of 10 GW. Figure 25.8 shows some blobs to scale on a map. To give a sense of the scale of these blobs I’ve dropped a few in Britain too. Four of these blobs would have an output roughly equal to Britain’s total electricity consumption (16 kWh/d per person for 60 million people). Sixty-five blobs would provide all one billion people in Europe and North Africa with 16 kWh/d per person. Figure 25.8 shows 68 blobs in the desert.
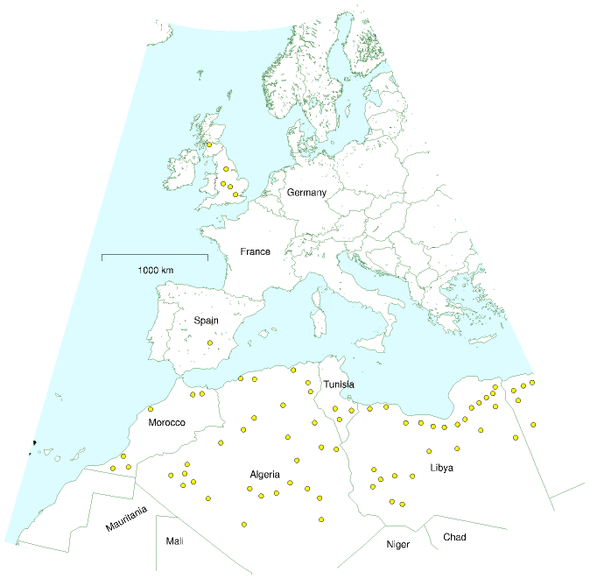
Figure 25.8. Each circular blob represents an area of 1500 km2, which, if one-half-filled with solar power facilities, would generate 10 GW on average. 65 such blobs would provide 1 billion people with 16 kWh/d per person.
Concentrating photovoltaics
(Figure omitted from this edition: third-party rights.)
Figure 25.9. A 25 kW (peak) concentrator photovoltaic collector produced by Californian company Amonix. Its 225 m2 aperture contains 5760 Fresnel lenses with optical concentration ×260, each of which illuminates a 25%-efficient silicon cell. One such collector, in an appropriate desert location, generates 138 kWh per day – enough to cover the energy consumption of half an American. Note the human providing a scale. Photo by David Faiman.
An alternative to concentrating thermal solar power in deserts is large-scale concentrating photovoltaic systems. To make these, we plop a high-quality electricity-producing solar cell at the focus of cheap lenses or mirrors. Faiman et al. (2007) say that “solar, in its concentrator photovoltaics variety, can be completely cost-competitive with fossil fuel [in desert states such as California, Arizona, New Mexico, and Texas] without the need for any kind of subsidy.”
According to manufacturers Amonix, 4 this form of concentrating solar power would have an average power per unit land area of 18 W/m2.
Another way to get a feel for required hardware is to personalize. One of the “25 kW” (peak) collectors shown in figure 25.9 generates on average about 138 kWh per day; the American lifestyle currently uses 250 kWh per day per person. So to get the USA off fossil fuels using solar power, we need roughly two of these 15 m×15 m collectors per person.
What happened to DESERTEC
A section added in the 2026 revision. This chapter rests on two things: a plan and a technology. Both failed within a decade, and neither failed for a reason MacKay was worried about. His arithmetic on the resource was right and remains right — the Sahara does receive what he says it receives, and the areas he shades on the map would deliver what he calculates.
The plan failed first, and fast. The Desertec Industrial Initiative was founded in 2009 with seventeen partners — Munich Re, Siemens, Deutsche Bank, E.ON, RWE, ABB among them — and a figure of €400 billion attached. Siemens and Bosch withdrew in 2012 and 2013. The Desertec Foundation and the industrial consortium separated in July 2013. By the end of 2014 three partners were left, and by 2015 what remained had relocated to Dubai with a skeleton staff. Five years from announcement to effectively over. The reasons given were cost, sovereign and security risk, water consumption in arid regions, and unresolved questions about who would own the electricity and on what terms — and, overwhelmingly, the Arab Spring, which between 2010 and 2012 changed the risk assessment of nearly every host country at once.5
The technology failed second, and more interestingly. MacKay’s chapter is specifically about concentrating solar power: mirrors, a working fluid, a turbine, and — the reason he chooses it — thermal storage, which lets the plant run into the evening. In 2008 that was the right bet. Concentrating solar with storage was dispatchable; photovoltaics were expensive and did nothing after dark.
| around 2008 | 2025 | |
|---|---|---|
| Concentrating solar, installed worldwide | under 1 GW | about 7 GW |
| Photovoltaics, installed worldwide | about 15 GW | around 2000 GW |
Concentrating solar grew by a factor of ten or so. Photovoltaics grew by more than a hundredfold, and now cost somewhere near $0.04 per kWh against $0.10 to $0.12 for concentrating solar — the photovoltaic figure being the one chapter 6 gives, $0.043 in 2024, rather than the lower numbers quoted in market surveys. The technology this chapter is built on lost, and it lost to the technology in chapter 6. Photovoltaic panels with lithium batteries now do what molten-salt storage was for, at a third of the price, with no working fluid, no turbine, no water and no moving mirrors to keep clean in a desert.
That is worth dwelling on, because it is a failure mode this book has now exhibited several times. MacKay chose concentrating solar over photovoltaics for a good reason, correctly reasoned, which was then reversed by a price collapse he did not expect. Being right about the physics and wrong about the cost is the characteristic error of energy forecasting, and it is the error chapter 6 documents from the other side.
Something did get built. Morocco’s Noor Ouarzazate complex — concentrating solar with molten-salt storage, alongside photovoltaics, around 580 MW, commissioned between 2016 and 2018 — was the largest concentrated solar facility in the world when it opened. It works. Against the tens of gigawatts DESERTEC envisaged across North Africa, it is a demonstration rather than a programme.
And then Britain was offered exactly this chapter, and refused it
The idea underneath DESERTEC was never really about mirrors. It was the interconnector: generate where the resource is, transmit to where the demand is. That has happened, just not from the Sahara — Britain now imports across cables to Norway, Denmark, France, the Netherlands, Belgium and Ireland.
And the specific proposal this chapter describes was put to the British government. Xlinks proposed 11.5 GW of Moroccan solar and wind, 22.5 GWh of batteries, and a 3.6 GW cable running about 4000 km to north Devon — which would have been by far the longest subsea power cable ever built. It had a route, a consent application, and a named counterparty. On 26 June 2025 the government declined to offer it a contract for difference, on the ground that it did not align with a strategic objective to prioritise domestically generated energy. The application was withdrawn, leaving the project with no route to market.6
Read that decision carefully, because it is this chapter’s question answered by a government in a single sentence. MacKay asks whether Britain can live on other countries’ renewables. Britain was offered the chance — engineered, priced and consented — and declined, not on grounds of cost or feasibility but because it preferred the electricity to be domestic.
That is the change this chapter did not anticipate, and could not have. MacKay treats the dependence question briefly and mostly as a matter of trust between friendly states. Then Russia invaded Ukraine, Europe discovered what a strategic dependence on imported energy costs when the exporter decides to use it, and “homegrown” stopped being a slogan and became a procurement criterion. It is chapter 18’s argument once more: the resource was never the binding constraint. Today the binding constraint on importing renewable energy is that nobody wants to depend on the import.
And the supplier’s consumers pay for it
There is a third case, and it is the one that most directly answers this chapter’s title, because it shows what happens to the country doing the exporting.
Norway is the ideal supplier in MacKay’s sense: hydroelectric, dispatchable, with reservoirs that store energy for months rather than hours. Two 1400 MW cables opened at the start of the 2020s — NordLink to Germany and the North Sea Link to Britain — and they did exactly what they were built to do. Norwegian water now backs up German and British wind.
The consequence in Norway was not the one the projects were sold on. Southern Norway, price area NO2, is where both cables land, and its prices are now set by whatever northern Europe is willing to pay. During the December 2024 wind lull, NO2 reached NOK 13.16 per kWh — about $1.18, the highest since 2009 — because German wind had failed and Norwegian water was worth what Germany would pay for it. Analysts put Norwegian prices roughly 25% lower without the interconnectors. Norwegian households were, in effect, bidding against German industry for Norwegian rain.
The politics followed. A majority in the Storting now opposes any further interconnectors; several parties want the British and German agreements renegotiated; and Labour campaigned in the 2025 election on turning off the older cables to Denmark when they come up for renewal in 2026.7
Set that beside the Hansa PowerBridge described in the section below: Sweden refused to build a cable to Germany, and Norway is discussing switching one off. Both are countries with cheap, clean, dispatchable electricity, and both have concluded that connecting to a more expensive market is a transfer from their own consumers to their own producers.
That is not a puzzle, it is what an interconnector does. A cable equalises prices, and equalisation is a transfer. The high-price side gains, the low-price side loses, the sum is positive — which is why the economics is favourable and the politics is not. It is the same structure as the industrial-price problem in chapter 28a and the same structure as the Xlinks refusal above: the resource flows fine; it is the distribution of the gains that stops the project.
MacKay asks whether Britain can live on other countries’ renewables. Eighteen years of evidence suggest the binding question is not whether Britain can, but whether the other country will keep agreeing to it.
And in July 2026, Britain stopped exporting
The last turn of this argument came while the chapter was being written, and it completes the pattern from the British end.
During several hours in July 2026, Britain’s system operator instructed traders not to export power at all across four of the country’s ten interconnectors — the links to Belgium, Denmark, Norway and France — to keep enough electricity at home. It was the first time the designation used for the restriction, “margin extremes”, had been applied to cut exports to zero. The hours were the morning and evening of 24 July and the evenings of 29, 30 and 31 July, during a heatwave. A month earlier, on the evening of 23 June, exports to Belgium had been cut abruptly when wind was low and evening demand high; that episode is now the subject of an investigation by the regulator, after control-room staff alleged the system was not being run securely.8
Summer used to be the easy season and is becoming the hard one. Heat raises demand for cooling, lowers the efficiency of thermal plant, and — across the Channel — drought has been shutting French reactors for want of river water to cool them. The interconnector was supposed to smooth exactly this, by letting each country lean on its neighbours. It works only if the neighbours are not short at the same moment, and a European heatwave is precisely the event that makes everybody short together.
So the ledger of this chapter now reads: Britain declined to import Moroccan sun in June 2025, Sweden declined to build a cable to Germany, Norway is discussing switching two off and has blocked new links until 2029, and in July 2026 Britain restricted its own exports to keep the lights on at home.
Every party to interconnection has pulled back from it within eighteen months, and not one of them for a reason found in this chapter. The resource did not change. What changed is that each country worked out what the cable does to it when supply is tight — and a market analyst quoted at the time put the risk plainly: it takes only a shift toward a more populist politics for the arrangement to be in trouble.
Which is the sharpest possible form of MacKay’s own question. He asks whether Britain can live on other countries’ renewables, and answers with geography and arithmetic. The answer arriving from events is that the physical system was built and the political willingness to use it is what turned out to be scarce.
What one degree buys
A section added in the 2026 revision. This chapter said above that heat raises demand for cooling, and left it there. It is the sort of claim this book is supposed to put a number on, and the number can be computed rather than quoted. Every grid has a band of temperatures at which it is comfortable and a slope away from that band in each direction: so many gigawatts per degree colder, so many per degree hotter. The Italians call the quantity termosensibilità, and the shape of the curve turns out to say more about a country than its size does.
Daily demand against a population-weighted daily mean temperature, weekdays from January 2021 to July 2026, with a straight line fitted to the days below 15 °C and another to the days above 20 °C. Six countries, one method, and the load taken from the system operators themselves.
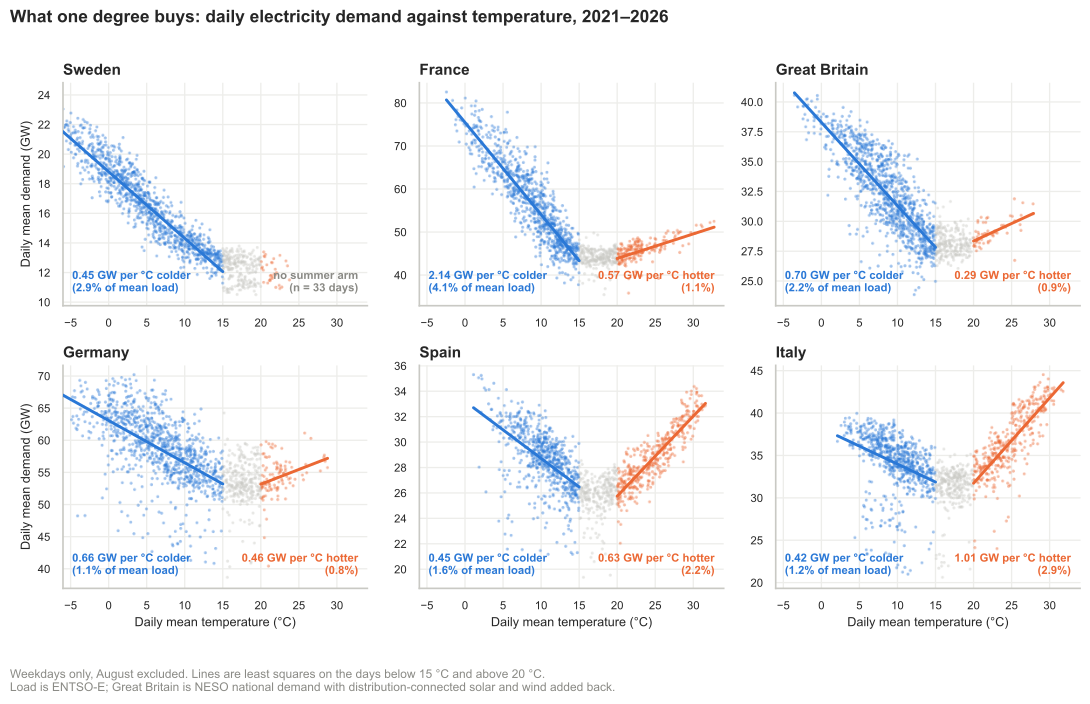
Figure 25.9a. Added in the 2026 revision. Each point is one weekday. August is excluded because industrial holidays move the base in several of these countries and would otherwise be read as a temperature effect. The slopes are conditional on being on the arm, so they are steeper than a sensitivity averaged over a whole year.9
France is the outlier, and it is the outlier because of how it heats. French demand falls 2.14 GW for every degree the country warms, which is 4.1% of its mean load per degree — against Germany’s 0.66 GW and Italy’s 0.42. Nothing about French weather explains that. France heats with electricity, so its winter demand is a thermostat setting written across a whole country. A five-degree cold snap in France moves 10.7 GW. For scale, the Moroccan cable this chapter spends its second half on would deliver 3.6 GW, so two cold degrees in France are worth more than the whole of Xlinks.
Italy is the same picture upside down, and it is the picture Britain is heading towards from the other side. Italy’s winter arm is nearly flat at 0.42 GW per degree, because Italy heats with gas and the electricity meter never sees it. Its summer arm is the steepest of the six at 1.01 GW per degree, 2.9% of mean load. Spain is sensitive at both ends for its size — 1.6% and 2.2% of mean load — and Germany is contained at both, at 1.2% and 0.8%, and Sweden has no measurable summer arm at all — thirty-three weekdays outside August above 20 °C in five and a half years, and a slope indistinguishable from zero.
Now put the summer arms together, because that is the interconnector question. Across the five countries here that have one, demand rises by about 3 GW for every degree of a European heat anomaly — and it rises in all five at once, because a heatwave over western Europe is one weather event and not five. Five degrees above normal across those countries is roughly 15 GW of extra demand appearing simultaneously in the places that were supposed to lend each other power. This is the arithmetic behind the July 2026 export restriction. The cable is only worth what the neighbour has spare, and thermosensitivity is a measure of how reliably the neighbour has nothing spare at exactly the wrong moment.
And there is a sting in this for the rest of the book. The winter arm is a map of how a country heats: steep where heating is electric, flat where it is gas. Chapter 7 recommends heat pumps, chapter 28a recommends electrifying industrial heat, and this chapter recommends cables. The first two make the third harder. Every gas boiler replaced moves a country a little way from Italy’s shape towards France’s, which means a colder winter’s night draws more, and draws more everywhere at once. That is not an argument against heat pumps — chapter 7’s case for them stands on its own arithmetic — but it is an argument that the plan has to say what supplies the new winter arm, and “the interconnector” is the answer this section has just shown to be weakest exactly when it is needed.
Queries
I’m confused! In Chapter 6, you said that the best photovoltaic panels deliver 20 W/m2 on average, in a place with British sunniness. Presumably in the desert the same panels would deliver 40 W/m2. So how come the concentrating solar power stations deliver only 15–20 W/m2? Surely concentrating power should be even better than plain flat panels?
Good question. The short answer is no. Concentrating solar power does not achieve a better power per unit land area than flat panels. The concentrating contraption has to track the sun, otherwise the sunlight won’t be focused right; once you start packing land with sun-tracking contraptions, you have to leave gaps between them; lots of sunlight falls through the gaps and is lost. The reason that people nevertheless make concentrating solar power systems is that, today, flat photovoltaic panels are very expensive, and concentrating systems are cheaper. The concentrating people’s goal is not to make systems with big power per unit land area. Land area is cheap (they assume). The goal is to deliver big power per dollar.
But if flat panels have bigger power density, why don’t you describe covering the Sahara desert with them?
Because I am trying to discuss practical options for large-scale sustainable power production for Europe and North Africa by 2050. My guess is that by 2050, mirrors will still be cheaper than photovoltaic panels, so concentrating solar power is the technology on which we should focus.
What about solar chimneys?
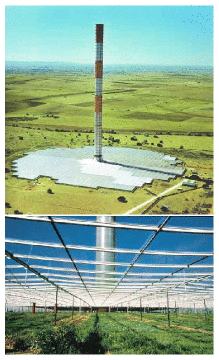
Figure 25.10. The Manzanares prototype solar chimney. Photos from solarmillennium.de.
A solar chimney or solar updraft tower uses solar power in a very simple way. 10 A huge chimney is built at the centre of an area covered by a transparent roof made of glass or plastic; because hot air rises, hot air created in this greenhouse-like heat-collector whooshes up the chimney, drawing in cooler air from the perimeter of the heat-collector. Power is extracted from the air-flow by turbines at the base of the chimney. Solar chimneys are fairly simple to build, but they don’t deliver a very impressive power per unit area. A pilot plant in Manzanares, Spain operated for seven years between 1982 and 1989. The chimney had a height of 195 m and a diameter of 10 m; the collector had a diameter of 240 m, and its roof had 6000 m2 of glass and 40 000 m2 of transparent plastic. It generated 44 MWh per year, which corresponds to a power per unit area of 0.1 W/m2. Theoretically, the bigger the collector and the taller the chimney, the bigger the power density of a solar chimney becomes. The engineers behind Manzanares reckon that, at a site with a solar radiation of 2300 kWh/m2 per year (262 W/m2), a 1000 m-high tower surrounded by a 7 km-diameter collector could generate 680 GWh per year, an average power of 78 MW. That’s a power per unit area of about 1.6 W/m2, which is similar to the power per unit area of windfarms in Britain, and one tenth of the power per unit area I said concentrating solar power stations would deliver. It’s claimed that solar chimneys could generate electricity at a price similar to that of conventional power stations. I suggest that countries that have enough land and sunshine to spare should host a big bake-off contest between solar chimneys and concentrating solar power, to be funded by oil-producing and oil-consuming countries.
What about getting power from Iceland, where geothermal power and hydroelectricity are so plentiful?
(Figure omitted from this edition: third-party rights.)
Figure 25.11. More geothermal power in Iceland. Photo by Rosie Ward.
Indeed, Iceland already effectively exports energy by powering industries that make energy-intensive products. Iceland produces nearly one ton of aluminium per citizen per year, for example! So from Iceland’s point of view, there are great profits to be made. But can Iceland save Europe? I would be surprised if Iceland’s power production could be scaled up enough to make sizeable electricity exports even to Britain alone. As a benchmark, let’s compare with the England–France Interconnector, which can deliver up to 2 GW across the English Channel. That maximum power is equivalent to 0.8 kWh per day per person in the UK, roughly 5% of British average electricity consumption. Iceland’s average geothermal electricity generation is just 0.3 GW, which is less than 1% of Britain’s average electricity consumption. Iceland’s average electricity production is 1.1 GW. 11 So to create a link sending power equal to the capacity of the French interconnector, Iceland would have to triple its electricity production. To provide us with 4 kWh per day per person (roughly what Britain gets from its own nuclear power stations), Iceland’s electricity production would have to increase ten-fold. It is probably a good idea to build interconnectors to Iceland, but don’t expect them to deliver more than a small contribution.
The reverse case, and the politics of it
A note added in the 2026 revision. MacKay frames this chapter as Britain buying other countries’ renewables. The 2020s produced a live example running the other way. Germany closed its last three nuclear reactors in April 2023 and, for the first time in many years, became a net electricity importer, drawing on hydro- and wind-rich Scandinavia.12 Because the Nordic and continental markets are coupled by interconnectors, German demand now reaches Swedish bills, and southern Sweden, wired directly to Germany, saw its prices rise. Swedish ministers publicly blamed Germany’s nuclear exit for higher prices at home.13 The counter-argument is that the feared German price spike never arrived: a year on, Germany had record renewable output and falling wholesale prices.14 So the dispute is less about a supply crisis than about who bears the cost of a coupled market, which is the question MacKay’s cheerful “living on someone else’s renewables” leaves open. The same coupling sits under the cannibalization model on the companion site.15
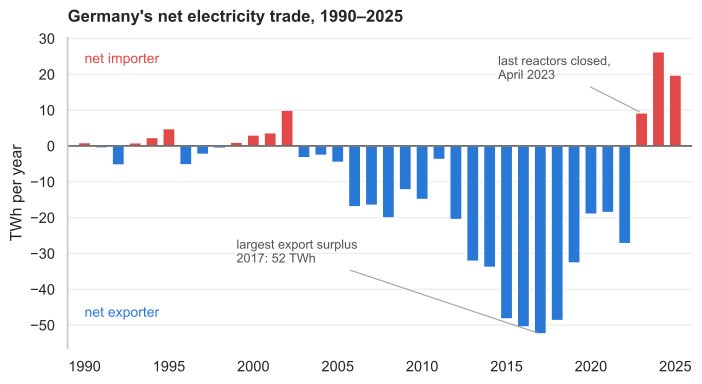
The trade figures show the turn plainly, and also show that it did not begin in 2023. Germany ran an export surplus for two decades, peaking at 52 TWh in 2017 — roughly a sixth of everything Britain generates in a year, sold across the border. That surplus then shrank year by year as coal and lignite plants closed, and 2023 was simply the year it crossed zero. Net imports came to 26 TWh in 2024 and 20 TWh in 2025, about 6% of German supply: small in itself, but it is the sign of the number, not its size, that the politics fastened on.16
There is a sharper case than the wholesale market, and it is a cable that was never built. The Hansa PowerBridge would have been a second link between Sweden and Germany: 700 MW, about 300 km, some 600 million euros, shared between the two grid operators and due around 2035. Sweden rejected it in June 2024, because it would have connected Germany to SE4, the southern Swedish bidding zone where prices are already the highest in the country. In 2024 the SE4 average was 50 EUR/MWh against 25 in the north, and 78 in Germany — and a cable pulls the low price up towards the high one.
An open-access study in Energy Policy modelled exactly this and found the Swedish objection to be well founded, not merely political.17 Building the link raises total welfare in both countries, by about 69 million euros a year in Sweden and 77 million in Germany in 2035. But inside Sweden the gain is unevenly placed: Swedish producers gain roughly 176 million while Swedish consumers lose about 106 million, and German consumers gain 455 million. The country is better off and the people paying the bills are worse off. That is the whole difficulty of MacKay’s chapter stated in one line: the arithmetic of “living on someone else’s renewables” can add up nationally and still fail the household, and no amount of insisting on the total will settle it.
The same study is more useful for what it does next, which is to ask what would fix it. Splitting the interconnector’s costs and revenues unevenly in Sweden’s favour is not enough on its own. Handing Swedish consumers the extra profits that the state-owned utility Vattenfall would earn is not enough on its own either. Doing both makes the project Pareto-improving, meaning nobody ends up worse off. So does something else entirely: splitting Germany’s single bidding zone in two, which shrinks the north-German-to-southern-Swedish price gap and with it the Swedish price rise, and then no transfers are needed at all. The obstacle to living on a neighbour’s renewables, in other words, is not the physics or the cost of the cable. It is that the winnings land on one side of the meter and the losses on the other, and Europe has not built the plumbing to move them back.
Taking it to the limit: solar power from orbit
A section added in the 2026 revision. This chapter’s move is to put the collectors where the sun is better and transmit the electricity to where the people are. Desert to Europe is one step. The limit case is orbit, and it is worth working through, because it fails for a reason this book keeps arriving at.
The physical case is genuinely strong. A panel in geostationary orbit sees the sun for about 99% of the year, with no night worth speaking of, no cloud, no atmosphere and no seasonal angle. It receives the full 1360 W/m² of the solar constant. Chapter 6 works with something nearer 110 W/m² for the average raw sunshine falling on a square metre in Britain once night, weather and latitude are counted — not the output of a panel, which is a fifth of that again. On raw insolation the orbital advantage is therefore about twelve to one. Advocates more often quote around seven, on comparisons that assume a sunnier terrestrial site than Britain; this edition uses the British figure because that is the one the rest of the book is built on. Microwave transmission at the frequencies proposed passes through cloud, and the receiving antenna can be a mesh that farmland sits under. So the resource argument, which is what defeats most of this book’s candidates, is the one argument space-based solar wins outright.
Then NASA costed it. In January 2024 the agency’s Office of Technology, Policy, and Strategy published a full lifecycle assessment of two reference designs, and the numbers are not close:18
| Lifecycle cost | Against terrestrial at $0.02–0.05/kWh | |
|---|---|---|
| Reference design 1 | $0.61/kWh | 12–31× |
| Reference design 2 | $1.59/kWh | 32–80× |
Launch is 71 to 77% of the cost, and the reason is a detail that decides the whole question. Reference design 1 needs 2321 launches to deliver 5.9 million kilograms of hardware — and twelve of every thirteen of those launches exist only to refuel the payloads waiting in low orbit so they can climb to geostationary. The satellites are not the problem. Getting them up the last part of the gravity well is.
The emissions answer is just as telling, and it is the one advocates rarely quote. At 26 and 40 grams of CO₂ per kilowatt-hour, the two designs are inside the range for terrestrial renewables, which is 13 to 43. Against the American grid’s 385 they are excellent; against the alternative they are ordinary. Space-based solar is not a low-carbon breakthrough. It is a low-carbon technology at thirty times the price.
It is not impossible, and the report is careful to say so. Combine launch at $500 (£395) per kilogram, electric propulsion for the orbital transfer, fifteen-year hardware life and aggressive manufacturing learning, and the cost falls to $0.03 and $0.08 per kilowatt-hour — competitive. Every one of those has to happen at once.
And the first of them is not fanciful, which is the strongest thing that can be said for the idea. The cost of reaching orbit has fallen further and faster than almost any figure in this book. The Space Shuttle, costed across the whole programme, came to something like $54 000 (£43 000) per kilogram to low orbit. A Falcon 9 is near $2700 (£2100) and a Falcon Heavy near $1400 (£1100) — a fall of about 97%, achieved mainly by landing and reflying the first stage rather than throwing it away. NASA’s enabling assumption of $500/kg is a further factor of three from there, on a curve that has already delivered a factor of forty. That is a very different kind of assumption from the ones this book usually has to reject. It remains true that the other four conditions must arrive with it, and that the emissions case does not improve merely because launch gets cheaper — but the launch cost, the thing that looked immovable when this chapter’s original argument was written, is the part that has actually moved.19
So the verdict is this chapter’s verdict, one step further out. The sunshine was never the problem. The cost of getting the collector to the sunshine is the entire answer, exactly as chapter M finds that the cost of delivering a fuel is most of its energy accounting. Free energy at the top of a gravity well is not free energy.
Mirrors instead of panels
There is a variant of the orbital idea that avoids the transmission problem entirely, and it is being funded. Rather than generating electricity in space and beaming it down, put mirrors in orbit and reflect sunlight onto solar farms that are already built — selling daylight after dark, so that a panel on the ground works into the evening.
Reflect Orbital has raised about $35 million (£28 million) for exactly this. Its published design is a mirror 18 metres square — 324 m² of aluminised film weighing 16 kg — at 600 to 650 km altitude, casting a spot about 5 km across, with a stated ambition of 50 000 reflectors by 2035 delivering 200 W/m² to customers. The first satellite, Eärendil-1 — a 142 kg spacecraft carrying the 18-metre reflector — was licensed by the American communications regulator on 9 July 2026 for launch later that year, over nearly 1900 public comments, most of them opposed.
This chapter’s method applies directly, and the numbers are unusually easy to check.
Start with the spot size, because it is not a design choice. The Sun is not a point: it subtends about half a degree, or 9.3 milliradians. Any flat mirror reflects an image of the Sun, so the patch of ground it lights cannot be smaller than that angle times the range. At 600 km that is 5.6 km across. The company quotes about 5 km, which is slightly below the flat-mirror limit — implying either a curved mirror or the lower end of its stated altitude range, both of which help a little and neither of which escapes the constraint. They are within a few per cent of the physical limit, and no engineering makes the spot much smaller. It follows that the only way to raise the intensity is to add mirrors.
Now the intensity from one mirror. 324 m² intercepting 1361 W/m² of sunlight, at 90% reflectivity, is about 400 kW of light. Spread over the company’s own 5 km spot — nearly 20 million square metres, and the figure most favourable to it — that is 0.02 watts per square metre.
For comparison, a full moon delivers roughly 0.003 W/m². One satellite is about six moons. It would be visible, and pretty, and it would generate essentially nothing: a solar farm under it would produce about fifty-thousandth of what it produces at noon.
So how many mirrors reach the 200 W/m² target? Two hundred divided by 0.02 is about ten thousand mirrors, all pointing at the same field at the same moment. Against a stated constellation of 50 000, that is a fifth of every satellite the company plans to launch, dedicated to lighting one solar farm — and each satellite is over any given site for only a few minutes per orbit.
And the demonstration figure needs care. The company reports having measured about 516 W/m² from a test at low altitude. That is entirely believable and tells you nothing about the orbital case, because intensity falls with the square of range. From 3 km the spot is 28 metres across and the intensity is around 650 W/m²; going to 600 km multiplies the range by 200 and divides the intensity by forty thousand. The demonstration and the product differ by that factor.
None of this makes the idea fraudulent or the engineering trivial — deploying and pointing a 16 kg film mirror from orbit is a real achievement, and the company appears to be doing real work. It makes it a very expensive way to buy a small amount of light. And there is a second objection this book is not the right place to adjudicate but should record. The European Southern Observatory calculates that the full constellation would raise background sky brightness at its Chilean sites by a factor of three to four; an astronomer at the Vera Rubin Observatory described the prospect as “the sky full of moons”, with the scattering unpredictable enough to endanger instruments; and environmental groups have raised the disruption of daily light cycles in plants and animals. The regulator approved the first satellite anyway, with a condition that the company work with NASA and the National Science Foundation on protecting optical astronomy.
That sequence is worth noticing on its own account, because it is the shape this edition keeps finding. A licence was granted for a demonstration whose physics is not in dispute, against objections about a constellation that does not exist yet, on conditions that amount to a promise to talk. Nobody in that process had to state how many mirrors it takes to light a solar farm — which is the one number that decides whether any of it matters.20
And there is a second lesson here, about how the case is made. The company’s engineering pages carry real numbers, which is how the arithmetic above was possible: 18 metres, 600 kilometres, a 5 km spot, 200 W/m². Its argument for why the world needs the thing carries none. That piece observes that billions lack reliable energy, that the world must produce “vastly more energy than ever before, at global scale, quickly enough to make a difference — all while keeping it clean”, and proposes reflecting sunlight from orbit. It contains no quantity of any kind: no demand figure, no intensity, no constellation size, no cost, and no comparison with a battery or a transmission line.
That is not dishonesty, and it is entirely normal corporate writing. It is also precisely the genre this book was written against. The prose is unfalsifiable and the engineering page is not — and the engineering page supplies every number needed, given the solar constant and a reflectivity, to work out that the concept requires about ten thousand mirrors per solar farm, which is a conclusion the company does not draw and this edition does.
Which is the whole method in one example, and the reason chapter 32 ends where it does. When somebody says a thing cannot be done, ask for the number. When somebody says it can, ask for the same number — and notice which document it appears in.
The honest summary is the one this chapter keeps reaching. The resource is real and the delivery is the whole problem — and here the delivery mechanism runs into a constraint that is not cost, not launch, and not engineering, but the angular diameter of the Sun.
What has been demonstrated, and what is proposed
Between those two arithmetics sits a gap worth stating plainly, because it is where most of the enthusiasm lives.
Start with what has flown. Caltech’s Space Solar Power Demonstrator carried MAPLE, an array of lightweight microwave transmitters, and in March 2023 it beamed power between a transmitter and two receivers about a foot apart, lighting a pair of LEDs. It also aimed a beam at the ground, where it was detected at Caltech. Both are genuine firsts and neither is a power supply: the achievement is that the hardware works at all, and it is the lightest integrated prototype of its kind by an order of magnitude.
Now set that against what is proposed. A one-gigawatt station needs a collector of more than one square kilometre — over a hundred times the size of the International Space Station, which took a decade to assemble with people on site, and which this one would have to match robotically. The European Space Agency’s assessment is that the cells must reach a power-to-weight ratio fifty times that of ordinary silicon, and that end-to-end conversion must reach 10 to 15%. Fifty times is not an increment. It is the difference between a technology that needs engineering and one that needs a different material.
And the beaming itself has a record, which is the cleanest scale check available. In May 2025 a DARPA programme transmitted more than 800 watts over 8.6 kilometres for thirty seconds by laser — with better than 20% end-to-end efficiency demonstrated at shorter ranges — and did it horizontally through the thickest part of the atmosphere rather than straight up. That obliterated the previous mark of 230 watts at 1.7 km. Across the whole test campaign more than a megajoule was transferred.
Put that in this book’s units. Thirty seconds at 800 watts is 0.007 kWh. The entire campaign’s megajoule is 0.28 kWh — about five minutes of an electric kettle. A proposed one-gigawatt station is a million times the power of that record, and would deliver the campaign’s whole energy output in one thousandth of a second. The record is a genuine achievement and it is a different technology from the microwave link a solar satellite would use; what it is not is evidence that the transmission problem is solved.21
The cost claims sit either side of NASA’s. The ESA’s Solaris lead expects to start at $100 to $200 per MWh — competitive with nuclear, above wind and solar — and to fall eventually below $50, against the $20 to $45 that American wind and solar cost in 2021. NASA’s own reference designs came out at $610 and $1590 per MWh. Both cannot be right, and the difference is not a disagreement about physics but about how much cheaper launch and manufacturing will get.22
If the hardware were not launched at all
Which brings the one argument that attacks the right term. Launch is 71 to 77% of NASA’s lifecycle cost. Every other proposal — better cells, cleverer antennas, longer life — nibbles at the remaining quarter. The only idea that touches the dominant term is to stop launching the mass: make the structure out of material that is already up there.
The idea is old in fiction — Daniel Suarez’s Delta-v is built on it — and it now has companies attached. TransAstra proposes capturing a 100-tonne asteroid and moving it to a stable near-Earth orbit as a robotic outpost for processing, with metals for structure, water for propellant and inert rock for shielding; a first mission that the company hoped to launch in 2026 and which had not flown when this was written, rendezvous in 2028 or 2029, and hundreds of later missions aggregating up to a million tonnes through the 2030s. It is at the funded-study stage — $2.5 million from NASA’s commercial research programme with matching private money — and its hardware so far is a one-metre prototype capture bag deployed on the Space Station in October 2025.23
Now do the arithmetic that matters, because it is more encouraging than this book’s usual answer and still not enough.
NASA’s reference design 1 needs 5900 tonnes of hardware. TransAstra’s ambition of a million tonnes is, in raw mass, about 170 such satellites — so the resource is not the constraint. The constraint is what fraction of a solar power satellite can be made from asteroid rock. Structure, shielding and reaction mass, plausibly. Photovoltaic cells and microwave electronics, not for a very long time.
Suppose that fraction is generous: everything except the cells and the electronics, and suppose those are a fifth of the mass. The launch term falls to a fifth of itself, and the lifecycle cost falls from $0.61 to about $0.26 per kWh. At three-tenths of the mass it is $0.31. That is more than a halving, and it is still five to fifteen times terrestrial solar.
So in-space resources are the strongest form of the argument, they attack exactly the right number, and on the most favourable assumption available they do not close the gap. The reason is the one this chapter keeps arriving at from different directions: when a cost is dominated by delivery, even cutting delivery to a fifth cuts the total by little more than half — and the thing being compared against has been falling faster than that for twenty years.
None of which says it will never happen, and the honest form of the objection is about sequence rather than possibility. Every step described here is real work by real engineers, and the launch cost has fallen further in this book’s lifetime than almost any other figure in it. But an asteroid-supplied orbital factory is a prerequisite of a cheap solar power satellite, not a consequence of one — and prerequisites of that size are how a technology stays thirty years away for fifty years.
The version that survives is not about Earth at all
There is a variant of the idea that the NASA arithmetic does not touch, and it is the more interesting one.
Everything above is the cost of sending power down. If the power is used in space, that entire problem disappears — no rectenna, no atmospheric path, and above all no fleet of launches whose only purpose is to lift a transmitter aimed at Earth. And there are processes that would rather be off Earth for reasons that have nothing to do with electricity: continuous unshadowed sunlight, hard vacuum available in unlimited quantity without pumping, and sustained microgravity. The candidates usually named are optical fibre of a kind that crystallises badly under gravity, certain pharmaceuticals and tissue growth, silicon wafers, and exotic metallurgy.24
And there is an argument that deserves to be stated because it is not the usual one: some processes are poisonous. Smelting, electrowinning and the separation of rare earths produce waste streams whose containment is a large part of their cost and most of their political difficulty. Somewhere with no biosphere changes what containment means.
Two things have to be said against that, and they are the same two this book says elsewhere. First, it is structurally the argument for relocating a dirty industry anywhere, and chapter 15 is about what happened when Britain solved its industrial emissions that way — the harm moved and the accounting stopped following it. An orbital smelter does not use less energy; it moves the harm somewhere the ledger does not reach, and adds a launch. Second, the economics only work if the output stays in space. Anything brought down pays the gravity well again in the expensive direction, and the whole case rests on materials being worth more at the top of the well than at the bottom.
Which is why beamed power’s honest niche is probably platform to platform rather than orbit to ground: no atmosphere, short distances, and a customer who cannot easily get energy any other way.
None of this belongs in this book’s kilowatt-hours per day per person, and it is not offered as British energy supply. If it ever matters, it will matter as somewhere to put industry rather than somewhere to get electricity from — and the number that decides it is dollars per kilogram to orbit, which is the number that decides everything else in the field too.
Notes and further reading
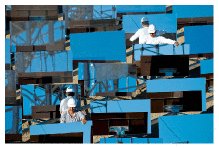
Figure 25.12. Two engineers assembling an eSolar esolar.com concentrating power station using heliostats (mirrors that rotate and tip to follow the sun). esolar.com make medium-scale power stations: a 33 MW (peak) power unit on a 64 hectare site. That’s 51 W/m2 peak, so I’d guess that in a typical desert location they would deliver about one quarter of that: 13 W/m2. esolar.com
(Figure omitted from this edition: third-party rights.)
Figure 25.13. A high-voltage DC power system in China. Photo: ABB.
Further reading: European Commission (2007), German Aerospace Center (DLR) Institute of Technical Thermodynamics Section Systems Analysis and Technology Assessment (2006), www.solarmillennium.de.
Concentrating solar power in deserts delivers an average power per unit area of roughly 15 W/m2. My sources for this number are two companies making concentrating solar power for deserts. www.stirlingenergy.com says one of its dishes with a 25 kW Stirling engine at its focus can generate 60 000 kWh/y in a favourable desert location. They could be packed at a concentration of one dish per 500 m2. That’s an average power of 14 W/m2. They say that solar dish Stirling makes the best use of land area, in terms of energy delivered. www.ausra.com uses flat mirrors to heat water to 285 °C and drive a steam turbine. The heated, pressurized water can be stored in deep metal-lined caverns to allow power generation at night. Describing a “240 MW(e)” plant proposed for Australia (Mills and LiÈvre, 2004), the designers claim that 3.5 km2 of mirrors would deliver 1.2 TWh(e); that’s 38 W/m2 of mirror. To find the power per unit land area, we need to allow for the gaps between the mirrors. Ausra say they need a 153 km by 153 km square in the desert to supply all US electric power (Mills and Morgan, 2008). Total US electricity is 3600 TWh/y, so they are claiming a power per unit land area of 18 W/m2. This technology goes by the name compact linear fresnel reflector (Mills and Morrison, 2000; Mills et al., 2004; Mills and Morgan, 2008). Incidentally, rather than “concentrating solar power,” the company Ausra prefers to use the term solar thermal electricity (STE); they emphasize the benefits of thermal storage, in contrast to concentrating photovoltaics, which don’t come with a natural storage option. Trieb and Knies (2004), who are strong proponents of concentrating solar power, project that the alternative concentrating solar power technologies would have powers per unit land area in the following ranges: parabolic troughs, 14–19 W/m2; linear fresnel collector, 19–28 W/m2; tower with heliostats, 9–14 W/m2; stirling dish, 9–14 W/m2. There are three European demonstration plants for concentrating solar power. Andasol – using parabolic troughs; Solúcar PS10, a tower near Seville; and Solartres, a tower using molten salt for heat storage. The Andasol parabolictrough system shown in figure 25.4 is predicted to deliver 10 W/m2. Solúcar’s “11 MW” solar tower has 624 mirrors, each 121 m2. The mirrors concentrate sunlight to a radiation density of up to 650 kW/m2. The receiver receives a peak power of 55 MW. The power station can store 20 MWh of thermal energy, allowing it to keep going during 50 minutes of cloudiness. It was expected to generate 24.2 GWh of electricity per year, and it occupies 55 hectares. That’s an average power per unit land area of 5 W/m2. (Source: Abengoa Annual Report 2003.) Solartres will occupy 142 hectares and is expected to produce 96.4 GWh per year; that’s a power density of 8 W/m2. Andasol and Solartres will both use some natural gas in normal operation.↩︎
HVDC is already used to transmit electricity over 1000-km distances in South Africa, China, America, Canada, Brazil, and Congo. Sources: Asplund (2004), Bahrman and Johnson (2007). Further reading on HVDC: Carlsson (2002).↩︎
Losses on a 3500 km-long HVDC line, including conversion from AC to DC and back,would be about 15%. Sources: Trieb and Knies (2004); van Voorthuysen (2008).↩︎
According to Amonix, concentrating photovoltaics would have an average power per unit land area of 18 W/m2. The assumptions of www.amonix.com are: the lens transmits 85% of the light; 32% cell efficiency; 25% collector efficiency; and 10% further loss due to shading. Aperture/land ratio of 1/3. Normal direct irradiance: 2222 kWh/m2/year. They expect each kW of peak capacity to deliver 2000 kWh/y (an average of 0.23 kW). A plant of 1 GW peak capacity would occupy 12 km2 of land and deliver 2000 GWh per year. That’s 18 W/m2.↩︎
The Desertec Industrial Initiative (Dii GmbH) was founded in Munich in 2009 by a consortium including Munich Re, Siemens, Deutsche Bank, E.ON, RWE, ABB and others, with a headline figure of about €400 billion (£345 billion) for the full vision. Siemens announced its withdrawal in 2012 and Bosch in 2013; the Desertec Foundation and Dii separated in July 2013; by the end of 2014 the membership had fallen to three — RWE, ACWA Power and State Grid Corporation of China — and the remaining organisation moved to Dubai as a consultancy. Accounts of why it failed differ in emphasis and most are retrospective journalism rather than analysis; the factors consistently cited are the capital cost against a falling photovoltaic price, sovereign and transit risk, water requirements for mirror cleaning and cooling in arid regions, disagreement over ownership and offtake terms between European and North African participants, and the political upheavals from 2010 onwards. Capacity figures: concentrating solar power worldwide is about 6.9 GW as of 2024, against photovoltaics above 1500 GW in 2025; the levelised cost comparison of roughly $0.035/kWh for photovoltaics against $0.10–0.118 for concentrating solar is from recent market surveys and, per chapter M, should be read as an ordering rather than as precise values. Noor Ouarzazate’s four phases total about 580 MW, of which roughly 510 MW is concentrating solar and the remainder photovoltaic.↩︎
The Xlinks Morocco–UK Power Project proposed 11.5 GW of generation (solar and wind) in Guelmim-Oued Noun, 22.5 GWh of battery storage, and a 3.6 GW high-voltage direct-current interconnector of about 4000 km to Alverdiscott in Devon, at a reported capital cost around £25 billion. On 26 June 2025 the UK government confirmed it would not proceed with a contract for difference, citing a lack of alignment with its objective of prioritising domestically generated energy; the developer subsequently withdrew its Development Consent Order application. The project has not been formally abandoned by its promoters, who have said they will seek other routes, so this edition records a government decision rather than the end of the scheme. The reasoning attributed to officials — a preference for “homegrown” supply — is from press reporting rather than from the published decision, and should be read as such; the published position is the alignment point.↩︎
NordLink (Norway–Germany, 1400 MW) and the North Sea Link (Norway–United Kingdom, 1400 MW) both entered commercial operation in 2021. The NO2 price of NOK 13.16/kWh was reached in mid-December 2024, its highest since 2009. The estimate that Norwegian prices would be about 25% lower without the interconnectors is an analyst calculation of forward prices rather than an observation, and depends on assumptions about hydrological conditions and about what Norwegian producers would otherwise do with the water; it should be read as an order of magnitude. Norwegian politics on this moved quickly between 2024 and 2025 and may move again: what is recorded here is that a Storting majority opposes further interconnection, that renegotiation of the British and German agreements has been proposed by several parties, and that the Skagerrak cables to Denmark come up for renewal in 2026. Note the countervailing case, which Norwegian proponents make: the cables also import cheap power in wet, windy periods, and the export revenue accrues to Norwegian producers, many of them publicly owned, so the transfer is partly from Norwegian households to Norwegian municipalities rather than out of the country.↩︎
Rachel Millard and Alan Smith, “Britain curbs power exports to Europe to preserve supplies”, Financial Times, August 2026, reporting the newspaper’s own analysis of National Energy System Operator data. Net transfer capacity restrictions are a long-standing tool available to the operator on four interconnectors — Nemo to Belgium, Viking to Denmark, North Sea Link to Norway and ElecLink to France; what was new in July 2026 was the use of the “margin extremes” designation to reduce day-ahead export capacity to zero, on 24, 29, 30 and 31 July. The June episode with Belgium is under investigation by Ofgem and by lawyers appointed by NESO, and the whistleblower allegations were raised in Parliament; nothing is established about them and this edition records only that an investigation exists. NESO’s own position is that such limits are a normal part of operating an increasingly dynamic system, are agreed and used by all system operators where needed, and do not diminish the interconnectors’ role in cross-border trade. Norway’s block on new interconnector development until 2029 is separate and is described in the note above.↩︎
Figure 25.9a is computed for this edition, not quoted. Method. Daily mean electricity demand against a population-weighted daily mean temperature, weekdays only, 1 January 2021 to 31 August 2026, with August dropped throughout — so the last month in the fit is July 2026. Two ordinary least-squares lines per country, on the days below 15 °C and the days above 20 °C. The thresholds are fixed rather than fitted. A fitted breakpoint would suit each country better and would make the six incomparable, which is the opposite of what the figure is for. Sources. Load is ENTSO-E, taken through the energy-charts API, the same route chapter 26 uses for prices. Great Britain is the exception twice over: its ENTSO-E feed has been incomplete since Brexit — no nuclear, no solar and no load series — so British demand comes from NESO’s own historic demand data, and it is taken as ND plus NESO’s estimates of distribution-connected solar and wind. Adding the embedded generation back matters more than it sounds. British national demand is metered at the transmission system, so rooftop and field-scale solar is netted off before it is counted; without the correction a hot sunny day registers as a fall in demand and Britain appears to have a negative summer arm. Temperatures are daily means from the Open-Meteo archive, which serves the ERA5 reanalysis — the source chapter 7’s Cambridge figure uses — averaged over the five largest cities of each country and weighted by approximate metropolitan population. The weights only weight the temperature. Four cautions. The slopes are conditional on being on the arm and are therefore steeper than a sensitivity computed across a whole year: Ember’s published figures, about 0.8% per degree for Europe as a whole and about 2.5% for France, are on the second basis and are not the same quantity as the 4.1% here. Winter days are short as well as cold, and this method cannot separate the lighting and behaviour part of the winter slope from the heating part, so the cold arm is an upper bound on what heating alone contributes. The Swedish summer slope is −0.21 GW per degree with a standard error of 0.13 on 33 days — weekdays outside August, so perhaps twice that many warm days in the calendar — which is not distinguishable from zero and is also confounded with the Swedish industrial summer; the figure says so rather than drawing it. And the 3 GW per degree for five countries added together assumes they warm together, which is what a European heatwave does and is not what every warm day does. The method is Alberto Pagnetti’s, “Termosensibilità: quanto pesa la temperatura sulla domanda elettrica”, Rivista Energia, 1 September 2026, which sets out the same construction for France, Italy, Spain and Germany from ENTSO-E and Meteostat data. The computation here is this edition’s own and adds Great Britain and Sweden; any error in it is not his.↩︎
Solar chimneys. Sources: Schlaich J (2001); Schlaich et al. (2005); Dennis (2006), www.enviromission.com.au, www.solarairpower.com.↩︎
Iceland’s average geothermal electricity generation is just 0.3 GW. Iceland’s average electricity production is 1.1 GW. These are the statistics for 2006: 7.3 TWh of hydroelectricity and 2.6 TWh of geothermal electricity, with capacities of 1.16 GW and 0.42 GW, respectively. Source: Orkustofnun National Energy Authority [www.os.is/page/energystatistics].↩︎
The electricity-import shift after the April 2023 nuclear exit: Clean Energy Wire, “Q&A – Germany’s nuclear exit: one year after”; on wider import dependence, Clean Energy Wire, “Germany and the EU remain heavily dependent on imported fossil fuels”.↩︎
Sweden’s criticism of German energy policy as prices rose: France 24, “Sweden sees red over Germany’s energy policy”, December 2024.↩︎
Fraunhofer ISE, “One year since Germany’s nuclear exit”, 2024; see also the German economy ministry’s earlier “get away from gas”, energiewende.bundeswirtschaftsministerium.de.↩︎
The cannibalization model and its references: https://oluies.github.io/elmix/modell/referenser.html .↩︎
Net electricity imports (imports minus exports), Ember via Our World in Data, https://ourworldindata.org/grapher/net-electricity-imports . The share of supply uses German generation of 431.7 TWh in 2024, from the Bundesnetzagentur’s 2024 electricity market data. UK generation for the 2017 comparison is about 290 TWh a year, from the same Our World in Data electricity dataset used elsewhere in this edition. Accounting bases differ: the Bundesnetzagentur’s commercial trade figures for 2023 are 54.1 TWh imported against 42.4 TWh exported, a net 11.7 TWh, where the Ember series plotted here gives 9.2 TWh. The sign and the shape of the turn are the same either way.↩︎
Polina Emelianova, Pia Hoffmann-Willers and Oliver Ruhnau, “Redistribution through cross-border electricity trade: How to achieve Pareto improvement for consumers?”, Energy Policy 218 (2026) 115522, https://doi.org/10.1016/j.enpol.2026.115522 , open access under CC BY. The welfare and surplus figures are their 2035 baseline case; the 2024 zonal prices in the paragraph above are theirs too, from ENTSO-E. The paper notes that the Swedish government signalled in early 2026 that it might reopen the project, conditional on Germany improving its price signals and adding baseload, so its fate is unsettled. Two other projects were stopped the same way: NorthConnect between Norway and the UK, cancelled in March 2023, and Eleclink 2 between Britain and France, paused by both regulators.↩︎
Erica Rodgers, Ellen Gertsen, Jordan Sotudeh, Carie Mullins, Amanda Hernandez, Hanh Nguyen Le, Phil Smith and Nikolai Joseph, Space-Based Solar Power, NASA Office of Technology, Policy, and Strategy, report ID 20230018600, 11 January 2024: https://www.nasa.gov/wp-content/uploads/2024/01/otps-sbsp-report-final-tagged-approved-1-8-24-tagged-v2.pdf. Baseline lifecycle costs of $0.61/kWh for reference design 1 and $1.59/kWh for reference design 2 in FY22 dollars, against 2050 projections of $0.02–0.05/kWh for terrestrial renewables. Launch accounts for 71% and 77% of cost respectively; RD1 requires 2321 launches for 5.9 million kg of mass and RD2 3960 launches for 10 million kg, with twelve of every thirteen launches serving only to refuel payloads in low Earth orbit for transfer to geostationary; 1.5 and 2 million spacecraft modules are manufactured. Lifecycle emissions of 26 and 40 gCO₂eq/kWh compare with 13–43 for terrestrial renewables and 385 for the 2021 US grid. The favourable combination — $500/kg launch, electric orbital transfer, fifteen-year hardware life, cheaper servicers, learning curves of 85% or better — gives $0.03 and $0.08/kWh and 3.78 and 4.33 gCO₂eq/kWh. Two notes on reading it. The study models Starship because it was the largest heavy-lift vehicle with published data, which NASA states is not an endorsement; and its favourable $500/kg is still well above SpaceX’s own stated ambition, so the report is not assuming the industry fails to improve — it is assuming it improves substantially and finding that this is not sufficient on its own.↩︎
Launch costs per kilogram to low Earth orbit are not published on a consistent basis and any comparison across eras involves choices. The Space Shuttle figure of roughly $54 000/kg — some sources give $60 000 — is the whole-programme cost divided by mass delivered, in inflation-adjusted terms, which is the fair basis for comparison with a commercial price but is much higher than the Shuttle’s marginal cost per flight. The Falcon 9 and Falcon Heavy figures are list prices divided by maximum stated payload, which flatters them, since few payloads fill the vehicle; SpaceX’s rideshare rate, the number a small customer actually pays, is around $7000/kg. The ~97% reduction is therefore a comparison of a fully burdened public programme against a commercial list price at full utilisation, and the honest statement is that the fall is large and real but that the precise percentage depends on which pair of numbers is chosen. Starship is advertised at figures an order of magnitude below Falcon Heavy; it had not flown an operational payload to orbit at the time of writing, so this edition quotes it as a target rather than a price.↩︎
Reflect Orbital’s published figures — 18 m square mirrors of aluminised film at about 16 kg, 600–650 km altitude, a roughly 5 km ground spot, about $35 million raised, a first satellite (Eärendil-1) on a rideshare in late 2026, an ambition of up to 50 000 reflectors by 2035 and a target of about 200 W/m² delivered — are the company’s own, as summarised in public reporting. The arithmetic here is this edition’s: the Sun’s angular diameter of 0.533° gives a minimum spot of 5.58 km at 600 km, matching the company’s own figure; 324 m² at 1361 W/m² and 90% reflectivity is 397 kW, which over a 5 km circular spot of 1.96 × 10⁷ m² is 0.020 W/m², requiring about 9900 mirrors simultaneously for 200 W/m². Three caveats in the company’s favour. A mirror could be given slight curvature or the constellation could use lower orbits, both of which reduce the spot somewhat, though neither escapes the angular limit by more than a modest factor. The relevant comparison for a solar farm may be energy over a pass rather than peak intensity. And the 200 W/m² figure may be intended as an aspiration for a mature constellation over a small number of premium sites rather than a general service. None of those changes the order of magnitude, which is the point at issue. The astronomical objections are the European Southern Observatory’s (a factor of three to four in background sky brightness at its Chilean sites), those of astronomers associated with the Vera C. Rubin Observatory, and those of dark-sky and environmental organisations; the company disputes their severity. Eärendil-1, a 142 kg spacecraft, was authorised by the United States Federal Communications Commission on 9 July 2026 after a proceeding that attracted nearly 1900 public comments, predominantly critical, with a condition that the company coordinate with NASA and the National Science Foundation on optical astronomy protection. That authorisation covers one demonstration satellite and not the constellation.↩︎
DARPA’s Persistent Optical Wireless Energy Relay programme, announced 16 May 2025: over 800 W received at 8.6 km for 30 seconds, better than 20% end-to-end efficiency measured at shorter ranges, using a laser transmitter and a receiver with a parabolic mirror feeding photovoltaic cells, tested in New Mexico; the previous reported best was 230 W at 1.7 km for 25 seconds, and more than a megajoule was transferred across the campaign. The programme is now complete. Two things stop this being a straightforward precedent for space solar. It is optical rather than microwave, and the two behave quite differently in atmosphere — a laser is stopped by cloud where a microwave link is not, which is the property that makes microwaves the choice for orbit-to-ground. And it was ground-to-ground, which the programme rightly presents as harder than a vertical path for a given distance, but which also means the range is about a four-thousandth of geostationary altitude and a seventieth of the 600 km orbits proposed for mirror constellations. The comparison in the text is therefore between the best beamed power anyone has demonstrated and the power a proposed station would deliver, which is a fair way to show the size of the remaining step and not a claim that the step is impossible.↩︎
Caltech’s Space Solar Power Demonstrator flew as SSPD-1 in January 2023; MAPLE, the Microwave Array for Power-transfer Low-orbit Experiment, demonstrated wireless power transfer between a transmitter and two receivers roughly a foot apart on 3 March 2023, lighting a pair of LEDs, and separately directed a beam that was detected at Caltech. The distinction between “detected” and “delivered” is the whole of the demonstration’s meaning and is often lost in reporting of it. The one-square-kilometre collector for a gigawatt station, the comparison with the International Space Station, the fifty-fold power-to-weight requirement and the 10 to 15% conversion target are from reporting of the European Space Agency’s Solaris work and a Nature account of the field; the cost expectations of $100–200 per MWh falling below $50 are Sanjay Vijendran’s for ESA, against $20–45 per MWh for American wind and solar in 2021 from the Energy Information Administration. Those figures come from advocates of the technology speaking about their own programme, which is worth stating beside NASA’s $610 and $1590, produced by an agency assessing rather than proposing. This edition quotes both and does not adjudicate between them; what it observes is that the disagreement is about future launch and manufacturing costs rather than about any physical quantity.↩︎
TransAstra’s proposal to capture a 100-tonne asteroid and move it to a stable near-Earth orbit, with a first mission the company hoped to launch in 2026 — not flown at the time of writing — rendezvous in 2028 or 2029, and later missions aggregating up to a million tonnes through the 2030s, is from SpaceNews reporting of the company’s plans; the funding is $2.5 million from NASA’s Commercial Research and Products Program with matching private investment, the propulsion is the company’s solar-thermal system, and the flight hardware to date is a one-metre prototype capture bag deployed on the International Space Station in October 2025. This is a funded feasibility study with a prototype, not a mining industry, and the dates should be read as intentions. The cost arithmetic in the text is this book’s own: NASA’s launch share of 71% for reference design 1 applied to its $0.61 per kWh, with the launched fraction reduced to the share of mass that cells and electronics represent, taken at a fifth and three-tenths. Both are guesses, chosen to be favourable to the proposal — a real satellite would also need to launch the manufacturing plant, which this calculation ignores entirely, and the asteroid material would have to be refined into aerospace-grade structure in orbit, which nobody has done with any material anywhere. The conclusion that the gap does not close is therefore robust to the assumption being wrong in the optimistic direction. Daniel Suarez’s Delta-v (2019) is a novel, and is cited as the place the idea is worked out at length rather than as evidence for it.↩︎
The list of processes said to favour orbit — ZBLAN optical fibre, pharmaceuticals and tissue growth, silicon wafers, exotic metallurgy — and the argument that asteroid material is worth most if it never comes down are from the author’s Q&A accompanying Daniel Suarez’s novel Delta-v: https://daniel-suarez.com/deltav_QandA.html. It is a novelist’s companion piece written to defend the plausibility of a story, not a technical assessment, and its figures should be treated accordingly — its claim of “700% more energy” for orbital solar is in the right region for the resource ratio but is not a delivered-energy comparison, and its 85% microwave transmission efficiency is an end-to-end figure that other sources put lower. It is cited here for the shape of the argument about which processes want to be off Earth, which is well made, rather than for its numbers. Note that the only one of these products currently manufactured in orbit at commercial scale is optical fibre, in small quantities.↩︎