12 Wave
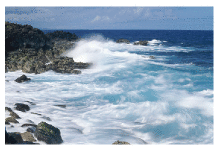
If wave power offers hope to any country, then it must offer hope to the United Kingdom and Ireland – flanked on the one side by the Atlantic Ocean, and on the other by the North Sea.
First, let’s clarify where waves come from: sun makes wind and wind makes waves.
Most of the sunlight that hits our planet warms the oceans. The warmed water warms the air above it, and produces water vapour. The warmed air rises; as it rises it cools, and the water eventually re-condenses, forming clouds and rain. At its highest point, the air is cooled down further by the freezing blackness of space. The cold air sinks again. This great solarpowered pump drives air round and round in great convection rolls. From our point of view on the surface, these convection rolls produce the winds. Wind is second-hand solar energy. As wind rushes across open water, it generates waves. Waves are thus third-hand solar energy. (The waves that crash on a beach are nothing to do with the tides.)
In open water, waves are generated whenever the wind speed is greater than about 0.5 m/s. The wave crests move at about the speed of the wind that creates them, and in the same direction. 1 The wavelength of the waves (the distance between crests) and the period (the time between crests) depend on the speed of the wind. The longer the wind blows for, and the greater the expanse of water over which the wind blows, the greater the height of the waves stroked up by the wind. Thus since the prevailing winds over the Atlantic go from west to east, the waves arriving on the Atlantic coast of Europe are often especially big. (The waves on the east coast of the British Isles are usually much smaller, 2 so my estimates of potential wave power will focus on the resource in the Atlantic Ocean.)
Waves have long memory and will keep going in the same direction for days after the wind stopped blowing, until they bump into something. In seas where the direction of the wind changes frequently, waves born on different days form a superposed jumble, travelling in different directions.
If waves travelling in a particular direction encounter objects that absorb energy from the waves – for example, a row of islands with sandy beaches – then the seas beyond the object are calmer. The objects cast a shadow, and there’s less energy in the waves that get by. So, whereas sunlight delivers a power per unit area, waves deliver a power per unit length of coastline. You can’t have your cake and eat it. You can’t collect wave energy two miles off-shore and one mile off-shore. Or rather, you can try, but the two-mile facility will absorb energy that would have gone to the one-mile facility, and it won’t be replaced. The fetch required for wind to stroke up big waves is thousands of miles.
We can find an upper bound on the maximum conceivable power that could be obtained from wave power by estimating the incoming power per unit length of exposed coastline, and multiplying by the length of coastline. We ignore the question of what mechanism could collect all this power, and start by working out how much power it is.
The power of Atlantic waves has been measured: it’s about 40 kW per metre of exposed coastline. 3 That sounds like a lot of power! If everyone owned a metre of coastline and could harness their whole 40 kW, that would be plenty of power to cover modern consumption. However, our population is too big. There is not enough Atlantic-facing coastline for everyone to have their own metre.
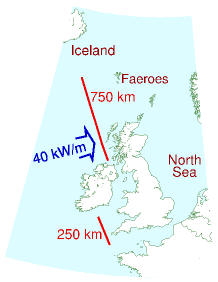
As the map shows, Britannia rules about 1000 km of Atlantic coastline (one million metres), which is 1⁄60 m per person. So the total raw incoming power is 16 kWh per day per person. If we extracted all this power, the Atlantic, at the seaside, would be as flat as a millpond. Practical systems won’t manage to extract all the power, and some of the power will inevitably be lost during conversion from mechanical energy to electricity. 4 Let’s assume that brilliant wave-machines are 50%-efficient at turning the incoming wave power into electricity, and that we are able to pack wavemachines along 500 km of Atlantic-facing coastline. That would mean we could deliver 25% of this theoretical bound. That’s 4 kWh per day per person. As usual, I’m intentionally making pretty extreme assumptions to boost the green stack – I expect the assumption that we could line half of the Atlantic coastline with wave absorbers will sound bananas to many readers.
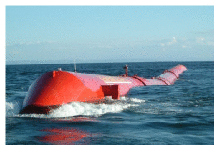
Figure 12.1. A Pelamis wave energy collector is a sea snake made of four sections. It faces nose-on towards the incoming waves. The waves make the snake flex, and these motions are resisted by hydraulic generators. The peak power from one snake is 750 kW; in the best Atlantic location one snake would deliver 300 kW on average. Photo from Pelamis wave power www.pelamiswave.com.
How do the numbers assumed in this calculation compare with today’s technology? As I write, there are just three wave machines working in deep water: three Pelamis wave energy collectors (figure 12.1) built in Scotland and deployed off Portugal. No actual performance results have been published, but the makers of the Pelamis (“designed with survival as the key objective before power capture efficiency”) predict that a two-kilometre long wave-farm consisting of 40 of their sea-snakes would deliver 6 kW per metre of wave-farm. Using this number in the previous calculation, the power delivered by 500 kilometres of wave-farm is reduced to 1.2 kWh per day per person. While wave power may be useful for small communities on remote islands, I suspect it can’t play a significant role in the solution to Britain’s sustainable energy problem.
What’s the weight of a Pelamis, and how much steel does it contain? One snake with a maximum power of 750 kW weighs 700 tons, including 350 tons of ballast. So it has about 350 tons of steel. That’s a weight-to-power ratio of roughly 500 kg per kW (peak). We can compare this with the steel requirements for offshore wind: an offshore wind-turbine with a maximum power of 3 MW weighs 500 tons, including its foundation. That’s a weight-to-power ratio of about 170 kg per kW, one third of the wave machine’s. The Pelamis is a first prototype; presumably with further investment and development in wave technology, the weight-to-power ratio would fall.
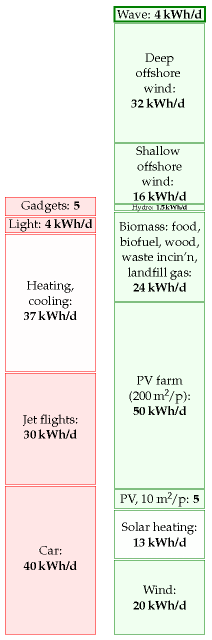
Figure 12.2. Wave.
What became of the wave machines
A section added in the 2026 revision. Few passages in this book can be checked as sharply as this one, because MacKay names the entire world industry: “As I write, there are just three wave machines working in deep water.”
The three machines
Those three Pelamis units at Aguçadoura, off Portugal, began generating in July 2008 and were towed back to dry dock in November 2008, four months later, with technical problems. They never returned. Babcock & Brown, the infrastructure company behind the project, went into voluntary administration in March 2009.
Pelamis Wave Power itself went into administration in November 2014 and ceased trading; its intellectual property was bought in January 2015 by Wave Energy Scotland, a body created by the Scottish Government for the purpose. Aquamarine Power, whose Oyster device was the other great British hope of the period, folded the same year.5
The number that settles it
Global installed wave energy capacity is about 2.3 MW.
The three Pelamis machines MacKay was describing were rated at 750 kW each: 2.25 MW. Eighteen years later, the entire world wave industry is the size of the snapshot he took of it. Ocean energy as a whole runs to roughly 513 MW, but almost all of that is tidal; wave added a fraction of a megawatt a year through the 2020s.
For scale, a single turbine at Dogger Bank, described in chapter 10, is 13 to 14.7 MW — about six times the world’s entire wave fleet.
Why: the machine must survive what it cannot use
The reason is the one MacKay’s own quotation hints at. He notes that Pelamis was “designed with survival as the key objective before power capture efficiency” — the designers put survival first, and it still was not enough.
Wave power scales with the square of wave height. A machine sized to harvest a two-metre sea must survive the storm that arrives once a century, and a device with a twenty-year design life is required to withstand a hundred-year return-period wave. The load that matters is not even the biggest wave but the breaking one: plunging breakers govern survivability and raise peak loads by 6 to 29% even when their crests are lower, because the damage is done by the impact mechanism rather than by height.
Underneath that sits a mismatch that no amount of engineering removes. Wave energy arrives at about 0.1 Hz with forces of the order of a meganewton — very slow, very large, and reversing. Electrical generators want the opposite: fast, small, and one-directional. Everything in between is hydraulics, seals and bearings, in salt water, unattended, for decades. That is the thing that breaks, and it is why measured conversion efficiencies end up well below 50% once every step is counted.
A wind turbine has the same problem and solves it by feathering. Above about 25 m/s it turns its blades edge-on and stops, shedding the load. A wave machine cannot shed the sea. It is in the water, and the water arrives whatever it does.
And nobody converged
There is a second reason, structural rather than physical, and it explains why eighteen years of effort produced so little.
Wind converged. By about 1990 the industry had settled on the three-bladed upwind horizontal-axis turbine, and everything since has been refinement — which is precisely why chapter 4 can describe a straight line from 1 MW machines to 14 MW ones. Every failure taught everybody.
Wave never converged. Attenuators, point absorbers, oscillating water columns, overtopping devices, bottom-hinged surge flaps: the concepts are not variations on a design but genuinely different machines, so a design load established for one is not reliable for another and each failure teaches only its own developer. The literature calls the result the wave energy paradox — too little deployment to generate learning, too little learning to attract investment, and so round again.
Was he right?
MacKay’s arithmetic gave 4 kWh/d per person as a deliberately extreme upper bound, requiring wave machines along half of Britain’s Atlantic coast, and 1.2 kWh/d using the developer’s own predicted performance. His conclusion was that “while wave power may be useful for small communities on remote islands, I suspect it can’t play a significant role in the solution to Britain’s sustainable energy problem.”
The figure Britain actually gets from wave power today is indistinguishable from zero at the precision this book works in. He was right, and if anything his 1.2 kWh/d was generous.
It is not quite dead. Wave Energy Scotland has kept development funded, Sweden’s CorPower Ocean and others continue to test, and the oscillating-water-column plant at Mutriku in Spain has been running since 2011. But the honest reading of eighteen years is that this chapter’s scepticism was the correct call, and that the reason was not the resource — the Atlantic really does deliver 40 kW per metre — but the machine’s inability to stay in the sea.
Notes and further reading
(Figure omitted from this edition: third-party rights.)
Photo by Terry Cavner.
(Figure omitted from this edition: third-party rights.)
Waves are generated whenever the wind speed is greater than about 0.5 m/s. The wave crests move at about the speed of the wind that creates them. The simplest theory of wave-production (Faber, 1995, p. 337) suggests that (for small waves) the wave crests move at about half the speed of the wind that creates them. It’s found empirically however that, the longer the wind blows for, the longer the wavelength of the dominant waves present, and the greater their velocity. The characteristic speed of fully-developed seas is almost exactly equal to the wind-speed 20 metres above the sea surface (Mollison, 1986).↩︎
The waves on the east coast of the British Isles are usually much smaller. Whereas the wave power at Lewis (Atlantic) is 42 kW/m, the powers at the east-coast sites are: Peterhead: 4 kW/m; Scarborough: 8 kW/m; Cromer: 5 kW/m. Source: Sinden (2005). Sinden says: “The North Sea Region experiences a very low energy wave environment.”↩︎
Atlantic wave power is 40 kW per metre of exposed coastline. (Chapter F explains how we can estimate this power using a few facts about waves.) This number has a firm basis in the literature on Atlantic wave power (Mollison et al., 1976; Mollison, 1986, 1991). From Mollison (1986), for example: “the large scale resource of the NE Atlantic, from Iceland to North Portugal, has a net resource of 40–50 MW/km, of which 20–30 MW/km is potentially economically extractable.” At any point in the open ocean, three powers per unit length can be distinguished: the total power passing through that point in all directions (63 kW/m on average at the Isles of Scilly and 67 kW/m off Uist); the net power intercepted by a directional collecting device oriented in the optimal direction (47 kW/m and 45 kW/m respectively); and the power per unit coastline, which takes into account the misalignment between the optimal orientation of a directional collector and the coastline (for example in Portugal the optimal orientation faces northwest and the coastline faces west).↩︎
Practical systems won’t manage to extract all the power, and some of the power will inevitably be lost during conversion from mechanical energy to electricity. The UK’s first grid-connected wave machine, the Limpet on Islay, provides a striking example of these losses. When it was designed its conversion efficiency from wave power to grid power was estimated to be 48%, and the average power output was predicted to be 200 kW. However losses in the capture system, flywheels and electrical components mean the actual average output is 21 kW – just 10% of the predicted output (Wavegen, 2002).↩︎
The Aguçadoura sequence — generation from July 2008, the three P1 units towed to dry dock in November 2008, Babcock & Brown into voluntary administration in March 2009 — and the later collapses of Pelamis Wave Power in November 2014 and Aquamarine Power in 2015, with Pelamis’s intellectual property passing to the Scottish Government’s Wave Energy Scotland in January 2015, are drawn from contemporaneous trade and news reporting and from the European Marine Energy Centre’s records of its own clients. Global installed wave capacity of about 2.3 MW, against roughly 513 MW for ocean energy as a whole including tidal, is from Ocean Energy Europe’s Ocean Energy Stats and Trends and REN21’s Global Status Report. The survivability figures — a hundred-year return period as the design condition for a twenty-year device, and breaking waves raising peak loads by 6–29% — are from the CFD survivability literature; note that these are modelled loads rather than measured failures, and that no public database records why individual deployed devices failed, which is itself part of the problem the text describes. The characterisation of the wave energy paradox follows the review literature on the sector’s commercial history.↩︎