17 Public services
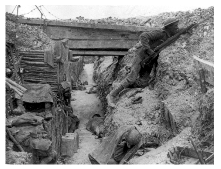
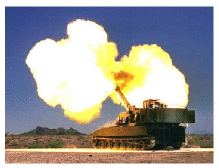
Every gun that is made, every warship launched, every rocket fired signifies, in the final sense, a theft from those who hunger and are not fed, those who are cold and are not clothed.
This world in arms is not spending money alone. It is spending the sweat of its laborers, the genius of its scientists, the hopes of its children.
President Dwight D. Eisenhower – April, 1953
The energy cost of “defence”
Let’s try to estimate how much energy we spend on our military.
In 2007–8, the fraction of British central government expenditure that went to defence was £33 billion/£587 billion = 6%. 1 If we include the UK’s spending on counter-terrorism and intelligence (£2.5 billion per year and rising), the total for defensive activities comes to £36 billion.
As a crude estimate we might guess that 6% of this £36 billion is spent on energy at a cost of 2.7p per kWh. (6% is the fraction of GDP that is spent on energy, and 2.7p is the average price of energy.) That works out to about 80 TWh per year of energy going into defence: making bullets, bombs, nuclear weapons; making devices for delivering bullets, bombs, and nuclear weapons; and roaring around keeping in trim for the next game of good-against-evil. In our favourite units, this corresponds to 4 kWh per day per person.
The cost of nuclear defence
The financial expenditure by the USA on manufacturing and deploying nuclear weapons from 1945 to 1996 was $5.5 trillion (in 1996 dollars). 2
Nuclear-weapons spending over this period exceeded the combined total federal spending for education; agriculture; training, employment, and social services; natural resources and the environment; general science, space, and technology; community and regional development (including disaster relief); law enforcement; and energy production and regulation.
If again we assume that 6% of this expenditure went to energy at a cost of 5¢ per kWh, we find that the energy cost of having nuclear weapons was 26 000 kWh per American, or 1.4 kWh per day per American (shared among 250 million Americans over 51 years).
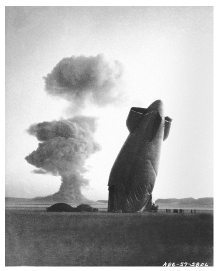
What energy would have been delivered to the lucky recipients, had all those nuclear weapons been used? The energies of the biggest thermonuclear weapons developed by the USA and USSR are measured in megatons of TNT. A ton of TNT is 1200 kWh. The bomb that destroyed Hiroshima had the energy of 15 000 tons of TNT (18 million kWh). A megaton bomb delivers an energy of 1.2 billion kWh. If dropped on a city of one million, a megaton bomb makes an energy donation of 1200 kWh per person, equivalent to 120 litres of petrol per person. The total energy of the USA’s nuclear arsenal today is 2400 megatons, contained in 10 000 warheads. In the good old days when folks really took defence seriously, the arsenal’s energy was 20 000 megatons. These bombs, if used, would have delivered an energy of about 100 000 kWh per American. That’s equivalent to 7 kWh per day per person for a duration of 40 years – similar to all the electrical energy supplied to America by nuclear power.
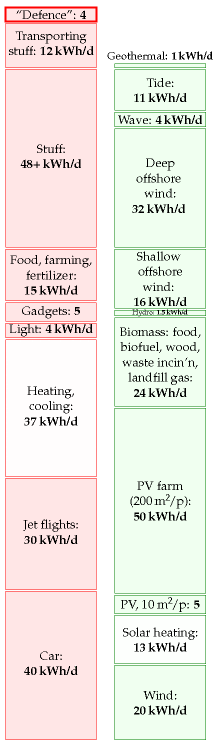
Figure 17.1. The energy cost of defence in the UK is estimated to be about 4 kWh per day per person.
Energy cost of making nuclear materials for bombs
The main nuclear materials are plutonium, of which the USA has produced 104 t, and high-enriched uranium (HEU), of which the USA has produced 994 t. Manufacturing these materials requires energy.
The most efficient plutonium-production facilities use 24 000 kWh of heat when producing 1 gram of plutonium. 3 So the direct energy-cost of making the USA’s 104 tons of plutonium (1945–1996) was at least 2.5 trillion kWh which is 0.5 kWh per day per person (if shared between 250 million Americans).
The main energy-cost in manufacturing HEU is the cost of enrichment. Work is required to separate the 235U and 238U atoms in natural uranium in order to create a final product that is richer in 235U. The USA’s production of 994 tons of highly-enriched uranium (the USA’s total, 1945–1996) had an energy cost of about 0.1 kWh per day per person. 4
“Trident creates jobs.” Well, so does relining our schools with asbestos, but that doesn’t mean we should do it!
Marcus Brigstocke
Universities
According to Times Higher Education Supplement (30 March 2007), UK universities use 5.2 billion kWh per year. Shared out among the whole population, that’s a power of 0.24 kWh per day per person.
So higher education and research seem to have a much lower energy cost than defensive war-gaming.
There may be other energy-consuming public services we could talk about, but at this point I’d like to wrap up our race between the red and green stacks.
The other column: what a war costs
A section added in the 2026 revision. This chapter opens with Eisenhower — every gun made is “a theft from those who hunger and are not fed” — and then counts defence as a pure cost, 4 kWh/d per person in Britain. That is one column of an account. The years since 2022 have supplied the other, and it belongs on the page for the same reason the first one does: it is measured in energy.
Ukraine
Before 2022 Ukraine had roughly 55 GW of installed generating capacity. By 2025 about 17.5 GW remained operational, and by February 2026 available capacity had fallen to around 11.5 GW — a loss of some 43.5 GW in four years of full-scale war, with the system running at roughly a third of its pre-invasion output.5
The detail is worse than the total. All fifteen of Ukraine’s thermal power stations have been damaged or destroyed, taking thermal generation from 23.5% of the mix to about 5%. Around half of its hydroelectric installations have been damaged and 40% destroyed, including the Kakhovka dam. Zaporizhzhia, the largest nuclear power station in Europe, has been forced offline by repeated strikes. In 2024 alone Ukraine lost about 9 GW, which is equivalent to a third of its pre-war consumption.
Set that beside this chapter’s British figure. Defence costs Britain 4 kWh/d per person. What Ukraine has lost is not a rate of expenditure but a stock: roughly four fifths of the machinery that made its electricity.
And the cost did not stay in Ukraine
Three chapters of this edition are already about the second-order effects, though none of them says so in these terms.
Chapter 13 records that about 70% of European ammonia capacity shut down by August 2022 when the gas price rose, because gas is up to 90% of the cost of making nitrogen fertilizer. Chapter 28a records German energy-intensive output settling at 82% of its 2021 level and staying there. Chapter N records the repricing of European gas that followed, and the strategic reserves drawn down since.
None of those appear in a defence budget. All of them are energy costs of a war.
What this does to the chapter
It does not make Eisenhower wrong. His argument is about opportunity cost in peacetime — what the same steel, laboratories and skilled hands could otherwise build — and that cost is real and is what MacKay’s 4 kWh/d measures.
But an account with a column for the cost of maintaining armed forces and no column for the cost of a war is incomplete, and this book is unusually well placed to say so, because both columns are denominated in the same units. Britain’s 4 kWh/d per person is a premium. Ukraine’s 43.5 GW is a claim. Whether the premium is priced correctly is not a question physics can answer, and this chapter does not attempt it. But the two numbers belong on the same page, and until now only one of them was.
There is a third column, in the other unit this book uses. Chapter 31 takes the same war and counts it in tonnes of carbon dioxide — 311 Mt CO2e over four years, of which the fighting itself is only 37% — and sets that beside what it would cost to take back out of the air.
The cost that is not in the account
And then there is the cost that this book cannot express at all.
Estimates of the human toll are contested, and the ranges are very wide. Ukraine’s government put its military dead at more than 46 000 in February 2025; an independent project identifying the dead by name had confirmed 96 821 by June 2026. Russian military deaths are estimated by independent Russian-language journalism at roughly 450 000 to 545 000, and by British and NATO assessments at around half a million killed within a far larger casualty total. The United Nations human rights office had verified 16 126 civilians killed and 46 590 wounded in Ukrainian-controlled areas by May 2026, and states plainly that the true figures are considerably higher.6
There is no honest way to put those numbers on a balance sheet denominated in kilowatt-hours, and it would be grotesque to try. That is worth saying explicitly rather than passing over, because it marks the boundary of the method this whole book rests on.
MacKay’s approach is deliberately narrow. It asks what the laws of physics permit and refuses to argue about anything else, and its great virtue — demonstrated across eighteen chapters — is that it settles questions that adjectives cannot. Chapter 18 records that the binding constraints on British energy have turned out to be prices, queues, permits and procurement cycles rather than joules. This is the strongest case of that same observation: the quantities that dominate the decision lie outside the account, and no amount of arithmetic inside it will reach them.
That is not a failure of the method. Knowing where a measurement stops is part of making it, and it is the thing MacKay insisted on more than any other.
The services MacKay left out
A section added in the 2026 revision. This chapter closes by saying “There may be other energy-consuming public services we could talk about, but at this point I’d like to wrap up our race between the red and green stacks.” Three of them are large. One can now be counted, two cannot, and trying to count them exposes a problem with the method this chapter uses.
Healthcare
The NHS estate in England consumed 11.1 billion kWh from all energy sources in 2023–24, which across the United Kingdom’s population is 0.44 kWh/d per person — nearly twice the universities’ 0.24, and the largest single public energy user in the country.7
Two things about that number matter more than its size.
Heating dominates it. Hot water and space heating account for about 80% of the NHS’s direct emissions. Chapter 7’s argument therefore applies to the health service more forcefully than to almost any other institution: the NHS is, energetically, a very large estate of buildings that must be kept warm, and its decarbonisation is a heat pump problem rather than a medical one.
And it is going the way chapter 15 describes. Estate emissions have fallen about 10% since 2019–20 and those from grid electricity by 21% — genuine progress. But scope 3, the supply chain, is roughly three quarters of the total footprint and has risen, so the NHS’s overall emissions have not fallen across five years. The pattern is the one chapter 15 identifies for the country as a whole: the part that is measured directly improves while the part that is bought in does not.
Police and local government: the numbers do not exist
There is no centralised national figure for the energy consumption of the police service in England and Wales. A decarbonisation programme was launched jointly by the Association of Police and Crime Commissioners, the National Police Chiefs’ Council and BlueLight Commercial, and individual forces publish fragments: the Metropolitan Police has 25 solar installations totalling 715 kWp, which generated about 487 MWh in 2021–22. Set against the NHS estate’s 11 100 000 MWh, that is a rounding error on a rounding error, and it is very nearly all that is publicly available.
Local government is the same. The government publishes total final energy consumption by local authority area, which counts everybody who lives and works there. What a council itself consumes — its offices, depots, leisure centres, vehicle fleets and the schools it maintains — is not collected centrally.
That is the third time this revision has run into a missing statistic, after the appliance-level breakdown withdrawn from the national energy accounts in chapter 9 and the absence of any figure for conventional hydro reservoir storage in chapter 8. A book of this kind depends on public statistics, and in places they are being withdrawn faster than they are being added.
The method does not survive the transfer
This is the part worth dwelling on, because it is a caution about the chapter rather than an addition to it.
MacKay’s defence figure comes from a rule of thumb: 6% of expenditure goes on energy, at 2.7p per kWh. Point that rule at the health service. NHS England’s budget is about £190 billion; 6% of it is £11.4 billion; at 2.7p per kWh that is 422 TWh — more than the entire United Kingdom’s annual electricity consumption, by half again.
The metered figure is 11.1 TWh. The heuristic overshoots by a factor of about forty.
Two separate things went wrong, and both are instructive.
The price is stale. 2.7p/kWh was an economy-wide average in 2008. At a blended public-sector rate nearer 15p, the same money buys a fifth as much energy — which takes the estimate to 76 TWh and still leaves it seven times too high.
And the 6% does not transfer. It is an economy-wide ratio, and it fits an activity that buys energy-intensive manufactured things — which defence does. Healthcare is labour-intensive: most of £190 billion is wages. At 11.1 TWh and roughly 15p, the NHS spends on the order of £1.7 billion on energy, under 1% of its budget, not 6%.
None of this makes the defence estimate wrong. It makes it what MacKay says it is — a crude bound, appropriate to an industry that manufactures. But it does mean the rule cannot simply be pointed at the rest of the public sector, and that the honest way to extend this chapter is to meter each service rather than to scale its budget. For one of the three services here that has been done. For the other two it has not.
Notes and further reading
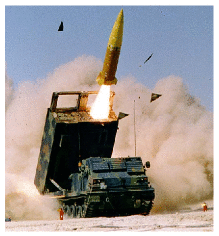
military energy budget. The UK budget can be found at [yttg7p]; defence gets £33.4 billion [fcqfw] and intelligence and counter-terrorism £2.5 billion per year [2e4fcs]. According to p14 of the Government’s Expenditure Plans 2007/08 [33x5kc], the “total resource budget” of the Department of Defence is a bigger sum, £39 billion, of which £33.5 billion goes for “provision of defence capability” and £6 billion for armed forces pay and pensions and war pensions. A breakdown of this budget can be found here: [35ab2c]. See also [yg5fsj], [yfgjna], and www.conscienceonline.org.uk. The US military’s energy consumption is published: “The Department of Defense is the largest single consumer of energy in the United States. In 2006, it spent $13.6 billion to buy 110 million barrels of petroleum fuel [roughly 190 billion kWh] and 3.8 billion kWh of electricity” (Dept. of Defense, 2008). This figure describes the direct use of fuel and electricity and doesn’t include the embodied energy in the military’s toys. Dividing by the US population of 300 million, it comes to 1.7 kWh/d per person.↩︎
The financial expenditure by the USA on manufacturing and deploying nuclear weapons from 1945 to 1996 was $5.5 trillion (in 1996 dollars). Source: Schwartz (1998).↩︎
The USA’s production of 994 tons of HEU… Material enriched to between 4% and 5% 235U is called low-enriched uranium (LEU). 90%-enriched uranium is called high-enriched uranium (HEU). It takes three times as much work to enrich uranium from its natural state to 5% LEU as it does to enrich LEU to 90% HEU. The nuclear power industry measures these energy requirements in a unit called the separative work unit (SWU). To produce a kilogram of 235U as HEU takes 232 SWU. To make 1 kg of 235U as LEU (in 22.7 kg of LEU) takes about 151 SWU. In both cases one starts from natural uranium (0.71% 235U) and discards depleted uranium containing 0.25% 235U. The commercial nuclear fuel market values an SWU at about $100. It takes about 100 000 SWU of enriched uranium to fuel a typical 1000 MW commercial nuclear reactor for a year. Two uranium enrichment methods are currently in commercial use: gaseous diffusion and gas centrifuge. The gaseous diffusion process consumes about 2500 kWh per SWU, while modern gas centrifuge plants require only about 50 kWh per SWU. [yh45h8], [t2948], [2ywzee]. A modern centrifuge produces about 3 SWU per year. The USA’s production of 994 tons of highly-enriched uranium (the USA’s total, 1945–1996) cost 230 million SWU, which works out to 0.1 kWh/d per person (assuming 250 million Americans, and using 2500 kWh/SWU as the cost of diffusion enrichment).↩︎
Figures for Ukraine’s generating capacity are drawn from International Energy Agency assessments of Ukraine’s energy security and from contemporaneous reporting: installed capacity of roughly 55 GW before the full-scale invasion, about 17.5 GW operational in 2025 and around 11.5 GW available by February 2026; approximately 64% of capacity destroyed or occupied as of September 2024; all fifteen thermal power stations damaged or destroyed, with thermal generation falling from 23.5% of the mix to around 5%; about half of hydroelectric installations damaged and 40% destroyed; roughly 9 GW lost during 2024, equivalent to a third of pre-war consumption; and the Zaporizhzhia nuclear plant forced offline. Three cautions. These are wartime figures, published under conditions that make independent verification difficult, and different sources use different baselines — installed, available and operational capacity are distinct quantities and are not always distinguished. “Destroyed or occupied” combines two very different situations: Zaporizhzhia is intact but not under Ukrainian control, while much thermal plant is physically wrecked. And capacity is not generation; some lost capacity had been idle before the war, and repairs have restored part of what was hit. The direction and the order of magnitude are not in dispute; individual figures should be expected to move.↩︎
Casualty estimates are from the compilation at https://en.wikipedia.org/wiki/Casualties_of_the_Russo-Ukrainian_war and the sources it cites: Ukrainian government figures of more than 46 000 military dead (February 2025); the UALosses project’s 96 821 confirmed by name (June 2026); a United States assessment of 57 500 or more Ukrainian military dead (October 2024); BBC News Russian and Mediazona’s count of roughly 447 900 to 545 267 Russian military dead (July 2026); a GCHQ estimate near 500 000 Russian dead (May 2026) and a NATO estimate of 1.3–1.45 million Russian casualties including about 500 000 killed (June 2026); and the UN Office of the High Commissioner for Human Rights’ verified 16 126 civilians killed and 46 590 wounded in Ukrainian-controlled areas (May 2026). These figures should be treated with more caution than anything else in this book. They are produced during an ongoing war by parties with an interest in the result, on incompatible methodologies, with restricted access to primary records; the spread between estimates of Russian military dead alone exceeds 200 000. OHCHR’s verified civilian count is a floor, not an estimate, and excludes Russian-controlled territory entirely, where Ukrainian officials have suggested the figure may be far higher. No figure here should be quoted without its source and date.↩︎
Total energy consumption of the NHS estate in England, 11.1 billion kWh from all sources in 2023–24, is from the Estates Returns Information Collection (ERIC) published by NHS England Digital, which also puts the total cost of running the estate at £13.6 billion. Note the boundary: ERIC covers the estate of NHS trusts in England, while the per-person figure here divides by the population of the whole United Kingdom, so it understates the English rate and is not a UK total; a proper UK figure would need the devolved health services added. Emissions figures — healthcare at roughly 4–5% of UK greenhouse gas emissions and about 40% of public-sector emissions in England, heating and hot water at about 80% of direct emissions, estates emissions down about 10% and grid-electricity emissions down 21% since 2019–20, and scope 3 at roughly three quarters of the total and rising — are from the Greener NHS five-year assessment and associated literature. Metropolitan Police solar figures, 25 installations of 715 kWp generating about 487 MWh in 2021–22, are from a London Assembly answer. The comparison with MacKay’s heuristic uses an NHS England budget of about £190 billion and a blended public-sector energy price near 15p/kWh; both are round figures chosen to make an order-of-magnitude point, and neither is a published statistic.↩︎