28 Putting costs in perspective
A plan on a map
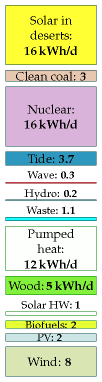
Figure 28.1. Plan M
Let me try to make clear the scale of the previous chapter’s plans by showing you a map of Britain bearing a sixth plan. This sixth plan lies roughly in the middle of the first five, so I call it plan M (figure 28.1).
The areas and rough costs of these facilities are shown in table 28.3. For simplicity, the financial costs are estimated using today’s prices for comparable facilities, many of which are early prototypes. We can expect many of the prices to drop significantly. The rough costs given here are the building costs, and don’t include running costs or decommissioning costs. The “per person” costs are found by dividing the total cost by 60 million. Please remember, this is not a book about economics – that would require another 400 pages! I’m providing these cost estimates only to give a rough indication of the price tag we should expect to see on a plan that adds up.
I’d like to emphasize that I am not advocating this particular plan – it includes several features that I, as dictator of Britain, would not select. I’ve deliberately included all available technologies, so that you can try out your own plans with other mixes.
For example, if you say “photovoltaics are going to be too expensive, I’d like a plan with more wave power instead,” you can see how to do it: you need to increase the wave farms eight-fold. If you don’t like the wind farms’ locations, feel free to move them (but where to?). Bear in mind that putting more of them offshore will increase costs. If you’d like fewer wind farms, no problem – just specify which of the other technologies you’d like instead. You can replace five of the 100 km2 wind farms by adding one more 1 GW nuclear power station, for example.
Perhaps you think that this plan (like each of the five plans in the previous chapter) devotes unreasonably large areas to biofuels. Fine: you may therefore conclude that the demand for liquid fuels for transport must be reduced below the 2 kWh per day per person that this plan assumed; or that liquid fuels must be created in some other way.
Cost of switching from fossil fuels to renewables
Every wind farm costs a few million pounds to build and delivers a few megawatts. As a very rough ballpark figure in 2008, installing one watt of capacity costs one pound; one kilowatt costs 1000 pounds; a megawatt of wind costs a million; a gigawatt of nuclear costs a billion or perhaps two. Other renewables are more expensive. We (the UK) currently consume a total power of roughly 300 GW, most of which is fossil fuel. So we can anticipate that a major switching from fossil fuel to renewables and/or nuclear is going to require roughly 300 GW of renewables and/or nuclear and
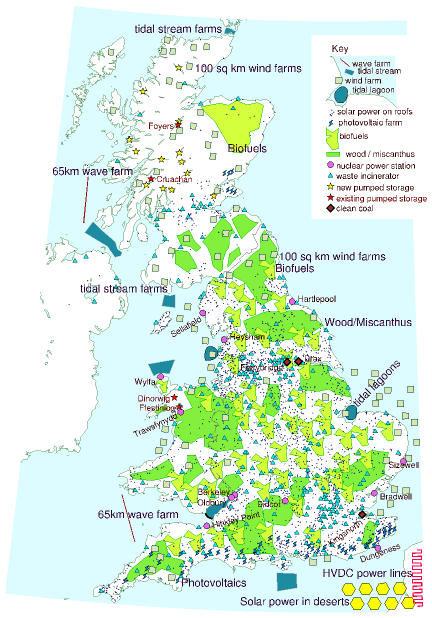
Figure 28.2. A plan that adds up, for Scotland, England, and Wales. The grey-green squares are wind farms. Each is 100 km2 in size and is shown to scale. The red lines in the sea are wave farms, shown to scale. Light-blue lightning-shaped polygons: solar photovoltaic farms – 20 km2 each, shown to scale. Blue sharp-cornered polygons in the sea: tide farms. Blue blobs in the sea (Blackpool and the Wash): tidal lagoons. Light-green land areas: woods and short-rotation coppices (to scale). Yellow-green areas: biofuel (to scale). Small blue triangles: waste incineration plants (not to scale). Big brown diamonds: clean coal power stations, with cofiring of biomass, and carbon capture and storage (not to scale). Purple dots: nuclear power stations (not to scale) – 3.3 GW average production at each of 12 sites. Yellow hexagons across the channel: concentrating solar power facilities in remote deserts (to scale, 335 km2 each). The pink wiggly line in France represents new HVDC lines, 2000 km long, conveying 40 GW from remote deserts to the UK. Yellow stars in Scotland: new pumped storage facilities. Red stars: existing pumped storage facilities. Blue dots: solar panels for hot water on all roofs. 1
| Capacity | Rough cost, total | Rough cost, per person | At 2025 prices | Average power delivered | |
|---|---|---|---|---|---|
| 52 onshore wind farms: 5200 km2 – based on Lewis wind farm |
35 GW | £27bn | £450 | £46bn | 4.2 kWh/d/p |
| 29 offshore wind farms: 2900 km2 – based on Kentish Flats, & including £3bn investment in jack-up barges |
29 GW | £36bn | £650 | £87bn | 3.5 kWh/d/p |
| Pumped storage: 15 facilities similar to Dinorwig | 30 GW | £15bn | £250 | £32bn | |
| Photovoltaic farms: 1000 km2 – based on Solarpark in Bavaria |
48 GW | £190bn | £3200 | £34bn | 2 kWh/d/p |
| Solar hot water panels: 1 m2 of roof-mounted panel per person (60 km2 total) | 2.5 GW(th) average | £72bn | £1200 | £110bn | 1 kWh/d/p |
| Waste incinerators: 100 new 30 MW incinerators – based on SELCHP |
3 GW | £8.5bn | £140 | £28bn | 1.1 kWh/d/p |
| Heat pumps | 210 GW(th) | £60bn | £1000 | £310bn | 12 kWh/d/p |
| Wave farms – 2500 Pelamis, 130 km of sea | 1.9 GW (0.76 GW average) | £6bn? | £100 | no price | 0.3 kWh/d/p |
| Severn barrage: 550 km2 | 8 GW (2 GW average) | £15bn | £250 | £33bn | 0.8 kWh/d/p |
| Tidal lagoons: 800 km2 | 1.75 GW average | £2.6bn? | £45 | £55bn | 0.7 kWh/d/p |
| Tidal stream: 15 000 turbines – 2000 km2 | 18 GW (5.5 GW average) | £21bn? | £350 | £90bn | 2.2 kWh/d/p |
| Nuclear power: 40 stations – based on Olkiluoto, Finland |
45 GW | £60bn | £1000 | £630bn | 16 kWh/d/p |
| Clean coal | 8 GW | £16bn | £270 | £40bn, as gas | 3 kWh/d/p |
| Concentrating solar power in deserts: 2700 km2 – based on Solúcar |
40 GW average | £340bn | £5700 | £420bn, or £100bn as photovoltaics | 16 kWh/d/p |
| Land in Europe for 1600 km of HVDC power lines: 1200 km2 – assuming land costs £7500 per ha |
50 GW | £1bn | £15 | £1.6bn | |
| 2000 km of HVDC power lines – based on German Aerospace Center estimates |
50 GW | £1bn | £15 | £20bn | |
| Biofuels: 30 000 km2 | (cost not estimated) | 2 kWh/d/p | |||
| Wood/Miscanthus: 31 000 km2 | (cost not estimated) | 5 kWh/d/p | |||
| Total | £870bn | £14 500 | £1940bn, or £1620bn with photovoltaics in the desert |
Table 28.3. Areas of land and sea required by plan M, and rough costs. Costs with a question mark are for technologies where no accurate cost is yet available from prototypes. “1 GW(th)” denotes one GW of thermal power. The “at 2025 prices” column was added in the 2026 revision: MacKay’s own quantities, priced at what Britain and the world pay for them now. It is in 2025 money and is therefore not directly comparable with his 2008 totals — his £870bn is about £1440bn in 2025 money.2
thus have a cost in the ballpark of £300 billion. The rough costs in table 28.3 add up to £870 bn, with the solar power facilities dominating the total – the photovoltaics cost £190 bn and the concentrating solar stations cost £340 bn. Both these costs might well come down dramatically as we learn by doing. A government report leaked by the Guardian in August 2007 3 estimates that achieving “20% by 2020” (that is, 20% of all energy from renewables, which would require an increase in renewable power of 80 GW) could cost “up to £22 billion” (which would average out to £1.7 billion per year). Even though this estimate is smaller than the £80 billion that the rule of thumb I just mentioned would have suggested, the authors of the leaked report seem to view £22 billion as an “unreasonable” cost, preferring a target of just 9% renewables. (Another reason they give for disliking the “20% by 2020” target is that the resulting greenhouse gas savings “risk making the EU emissions trading scheme redundant.” Terrifying thought!)
What a watt costs now
A section added in the 2026 revision. This chapter opens with a rule of thumb that carried the whole of it: “installing one watt of capacity costs one pound.” Table 28.3 shows MacKay did not quite apply it uniformly — his own implied prices span from a few pence a watt for transmission lines up to £8.50 for desert solar — but £1 a watt is the anchor, and it is what makes his £870 billion total feel like a number a country could contemplate.
The rule has not drifted. It has fractured. Work his own table backwards into pounds per watt, adjust for eighteen years of inflation, and set the result against what Britain now pays:
| MacKay’s implied cost | the same in 2025 money | Britain, 2025 | |
|---|---|---|---|
| Solar photovoltaic farms | £3.96/W | £6.50/W | about £0.70/W |
| Onshore wind | £0.77/W | £1.30/W | about £1.30/W |
| Offshore wind | £1.24/W | £2.05/W | about £3.00/W |
| Nuclear | £1.33/W | £2.20/W | about £14/W |
Onshore wind is the only line that held. In real terms it costs today almost exactly what MacKay assumed, which after eighteen years of a maturing industry is itself a mild disappointment.
Everything else moved, and two items moved enormously in opposite directions.4
Solar took £448 billion off the bill
The two solar entries dominate MacKay’s costing: photovoltaic farms at £190 billion and concentrating solar in deserts at £340 billion. Together that is £530 billion of an £870 billion plan — 61% of the whole thing.
Both numbers are now wrong, and in the same direction. Photovoltaics cost about a ninth of what this chapter assumes in real terms. And the desert concentrating solar, as chapter 25 records, is not merely dearer than expected but a technology that lost outright to photovoltaics and was never built at scale. Replace both with photovoltaic panels at 2025 prices — 193 GW of them, at about £0.70 a watt — and the same delivered energy costs £135 billion at 2025 prices, or about £82 billion in MacKay’s money, against his £530 billion, before storage.
One technology’s price collapse removed more from this plan than the entire cost of MacKay’s nuclear, wind, wave, tidal and coal programmes combined.
And nuclear put most of it back
MacKay costs 45 GW of nuclear at £60 billion, based on Olkiluoto — £1.33 a watt, and chapter 24 records what Olkiluoto actually cost in the end. Hinkley Point C is running at roughly £14 a watt. At that price, this chapter’s nuclear line alone would come to about £630 billion in 2025 money — £382 billion in MacKay’s.
Every wind farm, every wave machine, every tidal lagoon, the Severn barrage, the heat pumps, the incinerators, the interconnectors and both solar programmes together came to £870 billion in his money. Forty-five gigawatts of nuclear, at the price Britain is actually paying, would come to about 44% of that on its own — one line item against everything else in the plan combined.
The bill is about the same and it is a completely different bill
Putting the two together requires care, because a delta computed in 2025 money cannot be subtracted from a total stated in 2008 money. Doing it consistently in MacKay’s own 2008 pounds, so that his £870 billion total stands unaltered:
| in 2008 money | MacKay | re-costed | change |
|---|---|---|---|
| Both solar programmes | £530bn | £82bn | −£448bn |
| Nuclear, 45 GW | £60bn | £382bn | +£322bn |
| Rest of the plan | £280bn | £280bn | — |
| Total | £870bn | £744bn | −£126bn |
So the two do not cancel: solar takes out rather more than nuclear puts back, and the plan comes out about 14% cheaper than MacKay costed it, in his own money. That is a smaller residual than either individual change, which is the point — the total moved by a seventh while its two largest components each moved by a factor of about six and a half, in opposite directions.
The rest of the plan, which nobody was watching
That re-costing holds every other line at MacKay’s prices, which the note to it admits is generous. Price all of them at what they cost now — the right-hand column of table 28.3 — and the generosity turns out to be large. Fifteen of his lines can be given a 2025 price. Three came down, two held, and ten went up.
Heat pumps are the largest movement in the table after solar and nuclear, and unlike those two nobody has been arguing about it. MacKay costs 210 GW of thermal capacity at £60bn, which is £1000 a person, or about £2400 for a household. The Boiler Upgrade Scheme’s own statistics for July 2025 give an average installed cost of £12 500 for an average 8 kW machine — almost exactly the size his plan needs per household — so the line comes to about £310bn, against £99bn for his figure inflated. Some of that gap is definitional, since £2400 looks like the price of the machine and £12 500 is the price of the machine plus the pipework, the cylinder and the radiators the house turns out to need. But it is the definition Britain is paying to.
The marine lines moved further in proportion and matter less in absolute terms. Tidal lagoons rose by a factor of about thirteen once Swansea Bay had put a real number on a lagoon, and tidal stream by about two and a half. Waste incineration doubled. Long-distance transmission, which MacKay costed at a few pence a watt, rose about twelvefold. Offshore wind rose by half and pumped storage by about a third. Onshore wind and the land under the power lines held.
Three lines fell: photovoltaics, by a factor of nine, and — mildly — solar hot water and desert concentrating solar.
Put together, the whole of plan M at 2025 prices comes to about £1940 billion, or about £1620 billion if the desert concentrating solar is built as photovoltaics — against £1440 billion, which is MacKay’s own £870 billion in the same money. So the plan is not 14% cheaper. Repriced line by line it is about 13% dearer. Nuclear and the rest of the plan add about £930 billion between them; solar takes about £740 billion of that back off.
The headline is roughly intact and everything underneath it has inverted. In 2008 the plan was expensive because of solar and cheap because of nuclear. In 2026 it is cheap because of solar and ruinous because of nuclear.
That is worth stating plainly, because a reader who checks only the total would conclude the chapter had aged well. It aged well largely by luck. Two enormous errors in opposite directions is not the same as being right, and the next eighteen years will not be so obliging.
And the chapter’s real argument is untouched. MacKay’s point is not the precise total but that £870 billion is comparable to things Britain does anyway — the bank bailout, the Iraq war, a few years of military spending. That comparison holds exactly as well now, and rather better: an £870 billion programme spread over forty years is roughly £22 billion a year, which is about a third of what Britain spends on defence. The repriced plan does not change that: £1620 billion of 2025 money over forty years is about £40 billion a year, against a British defence budget of £62 billion in 2025/26. That £40 billion is an interest-free figure, which is the subject of the next section. The obstacle to this plan was never that the country could not afford it, which is the same conclusion chapters 24, 25, 26 and 27 reach from their own directions.
MacKay never priced the money
A section added in the 2026 revision. This chapter is careful about what its costs exclude. “The rough costs given here are the building costs, and don’t include running costs or decommissioning costs.” That is honest, and it leaves out one more thing, unmentioned, which has turned out to matter more than either: the price of the money.
Look again at the comparison the chapter closes on. £870 billion spread over forty years is £22 billion a year — and the repriced plan, £1620 billion of 2025 money, is about £40 billion a year on the same reasoning. That reasoning is an interest-free mortgage. Nobody builds a power station with a chequebook. Borrow the same £1620 billion over forty years and the annual bill is £70 billion at 3% and £94 billion at 5%, against £40 billion at nothing. The cost of the money is not a detail on top of the plan. Between plausible interest rates it is comparable to the entire cost of the hardware.5
And it bites hardest exactly where this book’s plans go. A gas station’s lifetime bill is mostly fuel, bought a year at a time; a wind farm’s is almost entirely interest on money spent before it generated anything. The IEA puts financing at 25 to 30% of the levelised cost of solar in advanced economies, and about half in developing ones, where the cost of capital is roughly double. Almost everything in table 28.3 is of the second kind — only the coal, the biofuels and the wood have a fuel bill worth the name. A plan built entirely of capital-heavy, fuel-free machines is a plan whose price is set in the bond market.
The same reactor at two prices
Britain has run the experiment. Hinkley Point C was financed at a cost of capital of about 9%. Sizewell C, the same design, the same regulator, the same decade, is being built under the Regulated Asset Base model at about 4.7%, because consumers pay during construction and so carry risk the developer would otherwise have to be paid to carry.
Over a thirty-five-year recovery period, 9% money costs about 77% more per year than 4% money for the identical station — and about 61% more than Sizewell’s 4.7%. The National Audit Office’s account of the arrangement is that investors’ returns may cost consumers as much as £4 billion early on, for a longer-term net benefit of up to £18 billion.
Nothing about the concrete changed. The chapter’s rule of thumb — one watt, one pound — has no place to put any of this, and it is the largest single lever anyone has pulled on British energy costs in the intervening eighteen years.
Germany has priced it
The best current arithmetic on this is German. In September 2026 McKinsey’s Energiewende-Index put the investment Germany needs by 2035 at €780 to €1035 billion — €680 to €910 billion for electricity, €60 to €80 billion for heat, and €40 to €45 billion for gas and hydrogen. The previous decade’s figure was about €400 billion, so this is a rise of between two and two and a half times. For 83 million people it is roughly €9400 to €12 500 each, which is the same order as the per-person column of table 28.3 and a useful check that this chapter’s magnitudes are not eccentric — though on a narrower definition, since the German figure counts infrastructure only and excludes what households and industry spend on insulation, heat pumps and charge points.
And the split inside the electricity half is the number this chapter most needs. Generation — taking installed photovoltaics and wind from about 200 GW in 2025 to as much as 510 GW in 2035 — costs €300 to €450 billion, with a further €30 to €60 billion for dispatchable capacity. The wires cost €200 to €250 billion for transmission and about €150 billion for distribution. That is €350 to €400 billion of cable and switchgear against €300 to €450 billion of generators: the network costs about what the machines cost.
Table 28.3 has two lines for this. They come to £2bn in MacKay’s prices, and £22bn even after the repricing in the right-hand column — against a repriced total of £1620bn, still under a fortieth of the plan. And it has no line at all for distribution. MacKay was costing an inventory of power stations, and half the bill is the thing that joins them up — which is chapter 26’s argument arriving as somebody’s capital plan.
What is new is that the study prices the financing separately. The sector’s cost of capital is 5.2 to 7.4%. Mobilising private infrastructure capital, chiefly by cutting equity ratios from 60% to 40%, would save €13 to €16 billion in financing costs over the decade — about €30 to €35 per household per year. The report’s own diagnosis is that the binding constraint is not the amount of capital in Germany but access to private infrastructure capital — roughly 500 of the country’s 900-odd utilities have balance sheets below €50 million, which is too small and too various for large investors to underwrite one at a time.
Be careful with that saving, though. It is not a discount on the whole €780–1035 billion: the levers are applied to a base the study puts at €500 to €625 billion, being the part of the investment it judges open to optimisation. Against that base the saving is about two and a half per cent, and against the full investment need about one and a half. The specific measure is modest either way. The variable behind it is not, and the two should not be confused. One percentage point on €900 billion, recovered over thirty-five years, is around €7 billion a year — every year, from a single number in a term sheet.
The unit was wrong all along
McKinsey’s global analysis of the same period makes the more general version of the point: $3.3 trillion went into the world’s energy system in 2025, and it bought a 30% increase in solar capacity alongside an oil demand rise of 1.3 million barrels a day and record coal consumption. Money spent is not the same as system value, because technologies differ in what they contribute — firm output, flexibility, resilience — and a total in dollars conceals all of it.
This chapter counts watts, which is one step better than counting dollars, and still not enough. Chapter 26 shows why: what a system short of wind on a February evening needs is not another watt of capacity but a watt available then. Chapter 28a puts a price on that timing.
MacKay’s conclusion survives all of this, and it is worth saying so. The obstacle was never affordability. But “affordable” turns out to be set in about equal measure by what the machines cost and by what the money costs, and this chapter — like almost every energy plan written since — prices only the first.
Other things that cost a billion
Billions are big numbers and hard to get a feel for. To try to help put the cost of kicking fossil fuels into perspective, let’s now list some other things that also come in billions of pounds, or in billions per year. I’ll also express many of these expenditures “per person,” dividing the total by an appropriate population.
Perhaps the most relevant quantity to compare with is the money we already spend on energy every year. In the UK, the money spent on energy by final users is £75 billion per year, and the total market value of all energy consumed is £130 billion per year. So the idea of spending £1.7 billion per year on investment in future energy infrastructure seems not at all unreasonable – it is less than 3% of our current expenditure on energy!
Another good comparison to make is with our annual expenditure on insurance: some of the investments we need to make offer an uncertain return – just like insurance. UK individuals and businesses spend £90 bn per year on insurance.
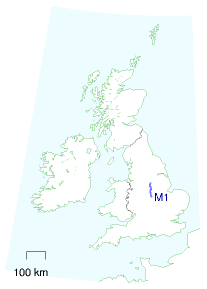
Figure 28.4. The M1, from junction 21 to 30.
Subsidies
£56 billion over 25 years: the cost of decommissioning the UK’s nuclear power stations and nuclear-weapon factories. That’s the 2004 figure; in 2008 it was up to £73 billion (£1200 per person in the UK). [6eoyhg]
Transport
£4.3 billion: the cost of London Heathrow Airport’s Terminal 5. (£72 per person in the UK.)
£1.9 billion: the cost of widening 91 km of the M1 (from junction 21 to 30, figure 28.4). [yu8em5]. (£32 per person in the UK.)
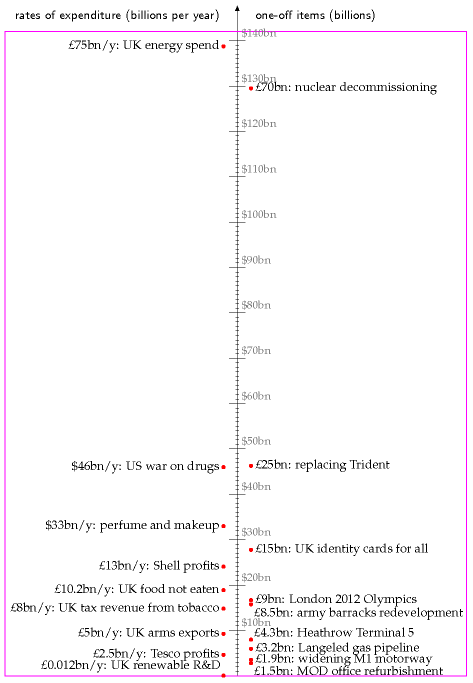
Figure 28.5. Things that run into billions. The scale down the centre has large ticks at $10 billion intervals and small ticks at $1 billion intervals.
Special occasions
Cost of the London 2012 Olympics: £2.4 billion; no, I’m sorry, £5 billion [3x2cr4]; or perhaps £9 billion [2dd4mz]. (£150 per person in the UK.)
Business as usual
£2.5 billion/y: Tesco’s profits (announced 2007). (£42 per year per person in the UK.)
£10.2 billion/y: spent by British people on food that they buy but do not eat. (£170 per year per person in the UK.)
£11 billion/y: BP’s profits (2006).
£13 billion/y: Royal Dutch Shell’s profits (2006).
$40 billion/y. Exxon’s profits (2006).
$33 billion/y. World expenditure on perfumes and make-up. 6
$700 billion per year: USA’s expenditure on foreign oil (2008). ($2300 per year per person in the USA.)
Government business as usual
£1.5 billion: the cost of refurbishment of Ministry of Defence offices. (Private Eye No. 1176, 19th January 2007, page 5.) (£25 per person in the UK.)
£15 billion: the cost of introducing UK identity card scheme [7vlxp]. (£250 per person in the UK.)
Planning for the future
£3.2 billion: the cost of the Langeled pipeline, which ships gas from Norwegian producers to Britain. The pipeline’s capacity is 20 billion m3 per year, corresponding to a power of 25 GW. [6x4nvu] [39g2wz] [3ac8sj]. (£53 per person in the UK.)
Tobacco taxes and related games
£8 billion/y: annual revenue from tobacco taxes in the UK [y7kg26]. (£130 per year per person in the UK.) The European Union spends almost e1 billion a year subsidising tobacco farming. www.ash.org.uk
$46 billion/y: Annual cost of the USA’s “War on drugs.” [r9fcf] ($150 per year per person in the USA.)
Space
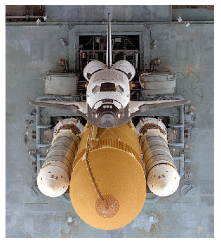
$1.7 billion: the cost of one space shuttle. ($6 per person in the USA.)
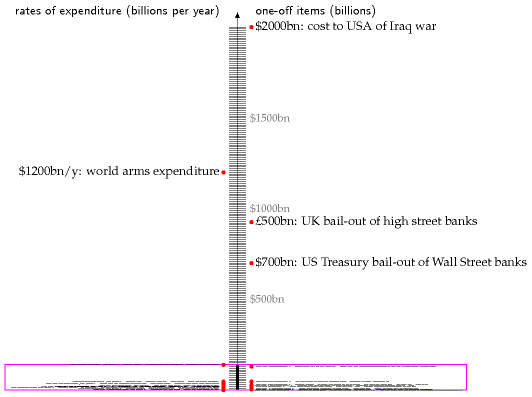
Figure 28.6. A few more things that run into billions. The vertical scale is squished 20-fold compared with the previous figure, figure 28.5, which is shown to scale inside the magenta box.
Banks
$700 billion: in October 2008, the US government committed $700 billion to bailing out Wall Street, and …
£500 billion: the UK government committed £500 billion to bailing out British banks.
Military
£5 billion per year: UK’s arms exports (£83 per year per person in the UK), of which £2.5 billion go to the Middle East, and £1 billion go to Saudi Arabia. Source: Observer, 3 December 2006.
£8.5 billion: cost of redevelopment of army barracks in Aldershot and Salisbury Plain. (£140 per person in the UK.)
£3.8 billion: the cost of two new aircraft carriers (£63 per person in the UK). news.bbc.co.uk/1/low/scotland/6914788.stm
$4.5 billion per year: the cost of not making nuclear weapons – the US Department of Energy’s budget allocates at least $4.5 billion per year to “stockpile stewardship” activities to maintain the nuclear stockpile without nuclear testing and without large-scale production of new weapons. ($15 per year per person in America.)
£10–25 billion: the cost of replacing Trident, the British nuclear weapon system. (£170–420 per person in the UK.) [ysncks].
$63 billion: American donation of “military aid” (i.e. weapons) to the Middle East over 10 years – roughly half to Israel, and half to Arab states. [2vq59t] ($210 per person in the USA.)
$1200 billion per year: world expenditure on arms [ym46a9]. ($200 per year per person in the world.)
$2000 billion or more: the cost, to the USA, of the [99bpt] Iraq war according to Nobel prize-winning economist Joseph Stiglitz. ($7000 per person in America.) 7
According to the Stern review, the global cost of averting dangerous climate change (if we act now) is $440 billion per year ($440 per year per person, if shared equally between the 1 billion richest people). In 2005, the US government alone spent $480 billion on wars and preparation for wars. The total military expenditure of the 15 biggest military-spending countries was $840 billion.
Expenditure that does not run into billions
£0.012 billion per year: the smallest item displayed in figure 28.5 is the UK government’s annual investment in renewable-energy research and development. 8 (£0.20 per person in the UK, per year.)
Notes and further reading
Figure 28.2. I’ve assumed that the solar photovoltaic farms have a power per unit area of 5 W/m2, the same as the Bavaria farm on p41, so each farm on the map delivers 100 MW on average. Their total average production would be 5 GW, which requires roughly 50 GW of peak capacity (that’s 16 times Germany’s PV capacity in 2006). The yellow hexagons representing concentrating solar power have an average power of 5 GW each; it takes two of these hexagons to power one of the “blobs” of Chapter 25.↩︎
Sources for the 2025-price column of table 28.3, line by line. Onshore wind, offshore wind, photovoltaic farms and nuclear use the same unit prices as the note above: £1.30, £3.00, £0.70 and £14 a watt. Nuclear at £14/W is Hinkley Point C; Sizewell C, at a baseline estimate of £38bn for 3.2 GW, is £11.90/W, so the line would be £535bn rather than £630bn on that basis. Pumped storage: Coire Glas, about £1.5bn for 1.4 GW, is £1.07/W. Solar hot water: a typical UK domestic system costs about £4500 installed, in a range from £3000 to £8000; 25 million households gives £110bn. MacKay’s specification of 1 m2 per person is a smaller collector than a typical install, but most of the price is the cylinder, the controls and the labour rather than the panel. Waste incineration: Cory’s Riverside 2, about £900m for 96 MW, is £9.40/W. Heat pumps: Boiler Upgrade Scheme statistics for July 2025, an average of £12 500 for an average 8.0 kW installation; MacKay’s 210 GW(th) across 60 million people is 3.5 kW each, or about 8.4 kW per household, so the plan is roughly 25 million installations. Wave: no price is given because there is no market to take one from — chapter 12 records that world installed wave capacity is about 2.3 MW. Severn barrage: the Severn Estuary Commission’s March 2025 report costs the Cardiff–Weston scheme at £33.4bn on 2023 prices. Tidal lagoons: Swansea Bay, £1.82bn on a 2025 cost base for 320 MW installed and about 60 MW average, which is £30 per average watt; MacKay’s 1.75 GW average is about twenty-nine Swansea Bays, hence £55bn. Tidal stream: MeyGen’s first 6 MW cost £51m, or £8.50/W, while ORE Catapult puts a 100 MW commercial array at £2.27m per MW; 18 GW therefore spans £41bn to £153bn and £90bn is the middle of it. Clean coal: no coal plant with capture exists anywhere, so the line is priced as gas with capture — Net Zero Teesside’s 742 MW sits inside a contract package of about £4bn that also buys the carbon dioxide transport and storage, which is roughly £5/W. Concentrating solar: the three plants built worldwide between 2021 and 2023 cost $4400, $6700 and $9700 per kW; at $6000/kW and a desert capacity factor near 45%, 40 GW of average output is about £420bn. The photovoltaic alternative is the one costed in the note above. Land for the power lines: Eurostat gives EU arable land at €15 224 per hectare in 2024, and 1200 km2 is 120 000 hectares. HVDC lines: China’s Gansu–Zhejiang link carries 8 GW over 2370 km for about $4.8bn, so six such lines running 2000 km come to roughly £20bn — MacKay’s £1bn was the one badly wrong number in his table that nobody has ever complained about. The total excludes the wave line, for which no price exists, and the biofuel and wood lines, which MacKay did not cost either; his £870bn includes £6bn for wave. Every 2025 figure is a capital cost and excludes running and decommissioning costs, as his do, and each carries the same width of uncertainty his did.↩︎
A government report leaked by the Guardian… The Guardian report, 13th August 2007, said [2bmuod] “Government officials have secretly briefed ministers that Britain has no hope of getting remotely near the new European Union renewable energy target that Tony Blair signed up to in the spring - and have suggested that they find ways of wriggling out of it.” The leaked document is at [3g8nn8].↩︎
MacKay’s implied costs are computed from his own table 28.3: onshore wind £27bn for 35 GW, offshore wind £36bn for 29 GW, photovoltaic farms £190bn for 48 GW, and nuclear £60bn for 45 GW. Inflation adjustment uses a factor of about 1.65 for UK consumer prices between 2008 and 2025; capital goods have not tracked consumer prices exactly, and construction cost inflation over the period ran higher, so this understates the real-terms fall in solar and overstates the rise in nothing. The 2025 figures are indicative capital costs rather than precise British averages: utility-scale solar around $690–700 per kW globally on IRENA figures, onshore wind near $1000–1300, UK offshore wind commonly quoted at £2500–3500 per kW, and Hinkley Point C at about £46bn for 3.26 GW, which is £14 100 per kW. Each is a range and each is sensitive to what is included — grid connection, financing during construction, and site works differ between sources. The comparison is offered as an ordering, per chapter M’s warning, and the argument does not turn on any single value: solar has fallen by roughly an order of magnitude and nuclear has risen by roughly an order of magnitude, and no plausible choice within these ranges changes that.
The re-costing in the table converts the 2025-price figures back into 2008 money by the same 1.65 factor so that every number in it is on MacKay’s basis: both solar programmes at £135bn in 2025 money — 193 GW at £0.70 a watt — become £82bn in 2008 money, and 45 GW of nuclear at £14 a watt, £630bn in 2025 money, becomes £382bn. The “rest of the plan” row is MacKay’s £870bn less his £530bn of solar and £60bn of nuclear, held constant — which is generous to him, since offshore wind has risen in real terms and would add roughly £17bn on the same basis. The re-costing of the two solar lines assumes the 40 GW average of desert concentrating solar is replaced by photovoltaic capacity delivering the same annual energy, which at a desert capacity factor near 28% is roughly 145 GW of panels, and prices both that and MacKay’s 48 GW of British photovoltaic farms at about £0.70 per watt. It excludes storage entirely, which concentrating solar provided thermally and photovoltaics do not — chapter 26 gives the cell cost of adding it, and adding it would narrow but not close the gap. It also excludes the transmission MacKay costs separately at £2bn, which would rise.↩︎
The annual figures are level annuities on £1620bn over forty years: £40.5bn at zero interest, £70.1bn at 3% and £94.4bn at 5%, all in 2025 money and therefore real rather than nominal rates. The 77% figure compares capital recovery factors over thirty-five years, 0.0946 at 9% against 0.0536 at 4%. These are the crudest possible treatment of financing — a real project draws the money down over a build, capitalises interest during construction, and refinances once the thing is running and the risk has fallen — but the crude version is enough to show that the omitted term is the same size as the term the chapter measures. Hinkley Point C’s cost of capital of about 9% and Sizewell C’s of about 4.7% under the Regulated Asset Base model, and the National Audit Office’s £4bn early cost and up to £18bn longer-term net benefit, are as reported in 2025; the National Audit Office’s own emphasis is that the RAB model transfers construction risk to consumers, which is precisely why the money is cheaper, and that this is a transfer rather than a saving until the station is finished. Sizewell C’s baseline construction cost is separately reported as 22% below the lowest current estimate for Hinkley. The IEA’s Cost of Capital Observatory is the source for financing at 25–30% of solar levelised cost in advanced economies and around half in emerging and developing ones, and for costs of capital roughly double in the latter. The German figures are from the McKinsey Energiewende-Index of September 2026, It’s the money, stupid — Finanzierung als Hebel zur Senkung der Energiesystemkosten: €780–1035bn to 2035, split €680–910bn electricity, €60–80bn heat and €40–45bn gas and hydrogen, against about €400bn in the preceding decade. Within the electricity half, €300–450bn is renewable generation (installed photovoltaic and wind capacity rising from nearly 200 GW in 2025 to as much as 510 GW in 2035), €30–60bn dispatchable capacity and batteries, €200–250bn transmission, and about €150bn distribution, the last extrapolated from the build plans of the 81 largest distribution operators. Investment by households, industry and building owners — insulation, heat pumps, charge points — is excluded from these figures, which matters when setting them beside table 28.3, whose heat pump line is exactly that. The cost of capital of 5.2–7.4% is KPMG’s 2025 cost-of-capital study, the upper end being small credit-financed municipal utilities and the lower end large utilities with capital-market access. The savings of €13–16bn over 2025–2035 — which the study annualises as €1.1–1.4bn a year, about €30–35 per household per year, implying an averaging period nearer eleven and a half years than the ten the text describes; over a flat decade it would be €1.3–1.6bn — come from cutting equity ratios from 60% to 40% (€9–11bn, a roughly 3-point equity-to-debt return spread worth about 60 basis points) and from bundling borrowing on the model of New Zealand’s Local Government Funding Agency (€4–5bn, up to 40 basis points off debt costs, 24 after weighting). Both are applied not to the full investment need but to a base the study states as €500–625bn, being the 30–40% of generation investment and 80–90% of grid investment it judges open to optimisation. Those shares do not reproduce that base from the figures the same report gives: 30–40% of €330–510bn of generation plus 80–90% of €350–400bn of grid comes to €380–565bn, some 20% below the stated range, and the report does not say what else is in it. The €500–625bn is used here because the €13–16bn saving is calculated from it. A further €10–20bn is available on refinancing the existing asset base. The study’s own comparison for the household figure is the 2026 fuel-duty rebate, €1.6bn or about €40 per household, once. The per-person conversion uses a German population of 83 million and is not adjusted for the fact that MacKay’s plan runs to 2050 while this one runs to 2035. The €7bn a year is one percentage point applied to €900bn recovered over thirty-five years, by the same capital recovery factors. The global investment figures — $3.3 trillion in 2025, oil demand up 1.3 million barrels a day, record coal, solar capacity up about 30% — are from McKinsey’s Investing in the energy transition: time to look at whole-system value. The index itself rates six of fifteen German indicators as realistically achievable, five as unrealistic and four as borderline, and records 4045 km of high-voltage line built against an interim target of 7904 km, on the way to a 2030 plan of 11 720 km — a third of the plan, scoring 49%, with the grid rather than the generation as the binding constraint, which is the finding of chapter 26 in another country’s data. Every score in the index is (current − zero point) ÷ (target − zero point), where the zero point is a stated level of failure rather than nothing: the transmission indicator’s is the 279 km standing when the index began, so 4045 km against a 7904 km interim target scores 49%, not the 51% the bare division gives. Two cautions follow from that scale. Its indicators are not commensurable: four of the fifteen score above 100%. Three — supply interruptions, reserve margin and import capacity from neighbours — do so because their target is no deterioration and their zero point is a badly degraded state, so any surplus scores above par. The fourth is renewable-energy jobs at 124%, which is 275 971 against a 2030 target of 222 000 from a zero point of no jobs at all; because that target sits below the index’s own 322 100 starting value, a fall of 46 000 jobs registers as beating it. And the indicators that measure whether anything is being built are, without exception, the ones failing: transmission line at 49%, electric vehicles at 40%, renewable heat at 35%, and — the consequence of not building — the cost of grid interventions at 20%, which is €12.2 per MWh against a target of €1. A note for readers following the German coverage: the round number quoted there is eine Billion Euro, which is a million million — one trillion in English, not one billion.↩︎
… perfume… Source: Worldwatch Institute www.worldwatch.org/press/news/2004/01/07/↩︎
…wars and preparation for wars… www.conscienceonline.org.uk↩︎
Government investment in renewable-energy-related research and development. In 2002–3, the UK Government’s commitment to renewable-energy-related R&D was £12.2 million. Source: House of Lords Science and Technology Committee, 4th Report of Session 2003–04. [3jo7q2] Comparably small is the government’s allocation to the Low Carbon Buildings Programme, £0.018bn/y shared between wind, biomass, solar hot water/PV, ground-source heat pumps, micro-hydro and micro CHP.↩︎